Question
In: Chemistry
a. Sketch a cooling curve as you go from a gas to a solid for a...
a. Sketch a cooling curve as you go from a gas to a solid for a pure substance.
b. Label each segment.
c. Explain the regions.
d. Why are there slope changes in your curve?
e. Describe what is happening on a cooling curve when you have a level, horizontal line (no change in temperature over time).
Solutions
Expert Solution

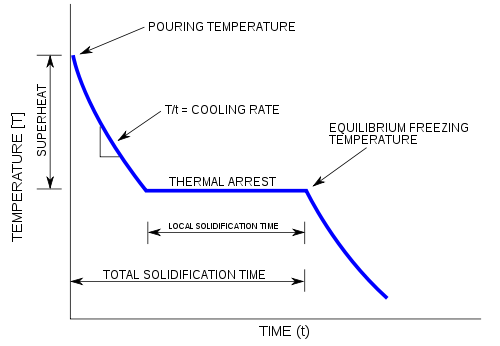
The initial point of the graph is the starting temperature of the matter, here noted as the "pouring temperature". When the phase change occurs there is a "thermal arrest", that is the temperature stays constant. This is because the matter has more internal energy as a liquid or gas than in the state that it is cooling to. The amount of energy required for a phase change is known as latent heat. The "cooling rate" is the slope of the cooling curve at any point.
In the part of the curve where the temperature decreases, the kinetic energy also decreases while the potential energy stays the same. However, at the phase transition, where the curve is flat, the kinetic energy stays the same while the potential energy decreases
Related Solutions
Unlike on the liquid-gas coexistence curve, on the liquid-solid coexistence curve, we can assume that the...
Construct a cooling curve (looks the same as a heating curve) for a substance with a...
2 a) Draw a neat sketch of Hauled Container System. b) Municipal solid waste from the...
Gas Transport: A trout swims from its normal cold water habitat into a warm water cooling...
Sketch the graph of the curve ? = 1 + sin ? for 0 ≤ ?...
Solid diiodine pentoxide reacts with carbon monoxide gas to form solid iodine and carbon dioxide gas....
Uranium hexafluoride (UF6) sublimes from a solid to a gas and boils at a very low...
Curve sketching: Choose two of the functions to sketch a graph. you should include the following...
) One of the major functions of cooling tower is to cool hot but dry gas...
cooling a gas in a piston cylinder. if the boundary work of piston cylinder is compressed...
- Write a MARIE program that asks the user for a beginning and an ending address of...
- Calculate the energy gap in J, kJ/mol, eV, and wavenumber (cm-1) between the level n =...
- 2. a. Choose all of the following that apply to DynamoDB: (a) DynamoDB is part of...
- I asked this question before, but I'm wondering if there are any other ways to do...
- Can you please Describe your actions as the Manager, and how you would manage the project...
- Suppose we have a collection of n different subsets of the set { 1, 2, ...,...
- def read_list(): """ This function should ask the user for a series of integer values (until...
 queen_honey_blossom answered 3 years ago