Question
In: Economics
9. Regulating a natural monopoly Consider the local telephone company, a natural monopoly. The following graph...
9. Regulating a natural monopoly
Consider the local telephone company, a natural monopoly. The following graph shows the monthly demand curve for phone services and the company's marginal revenue (MR), marginal cost (MC), and average total cost (ATC) curves.
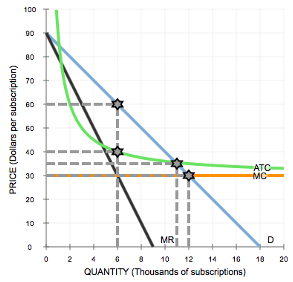
Suppose that the government has decided not to regulate this industry, and the firm is free to maximize profits, without constraints.
Complete the first row of the following table.
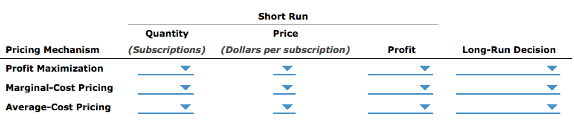
Suppose that the government forces the monopolist to set the price equal to average total cost.
Complete the third row of the previous table.
True or False: Over time, the telephone company has a very strong incentive to lower costs when subject to average-cost pricing regulations.
True
False
Solutions


 Rahul Sunny answered 4 years ago
Related Solutions
9. Regulating a natural monopoly Consider the local telephone company, a natural monopoly. The following graph...
9. Regulating a natural monopoly Consider the local telephone company, a natural monopoly. The following graph shows the monthly demand curve for phone services and the company's marginal revenue (MR), marginal cost (MC), and average total cost (ATC) curves. Suppose that the government has decided not to regulate this industry, and the firm is free to maximize profits, without constraints. Complete the first row of the following table. Suppose that the government forces the monopolist to set the price equal to marginal cost. Complete the...
9. Regulating a natural monopolyConsider the local telephone company, a natural monopoly. Thefollowing graph...
9. Regulating a natural monopolyConsider the local telephone company, a natural monopoly. The
following graph shows the monthly demand curve for phone services
and the company’s marginal revenue (MR), marginal cost (MC), and
average total cost (ATC) curves.Suppose that the government has decided not to regulate this
industry, and the firm is free to maximize profits, without
constraints.
9. Regulating a natural monopoly Consider the local cable company, a natural monopoly. The following graph...
9. Regulating a natural monopoly Consider the local cable company, a natural monopoly. The following graph shows the monthly demand curve for cable services and the company's marginal revenue (MR), marginal cost (MC), and average total cost (ATC) curves. Suppose that the government has decided not to regulate this industry, and the firm is free to maximize profits, without constraints. Complete the first row of the following table. Suppose that the government forces the monopolist to set the price equal to marginal cost. Complete the...
Consider the local telephone company, a natural monopoly. The following graph shows the monthly demand curve...
Consider the local telephone company, a natural monopoly. The following graph shows the monthly demand curve for phone services and the company's marginal revenue (MR), marginal cost (MC), and average total cost (ATC) curves. Suppose that the government has decided not to regulate this industry, and the firm is free to maximize profits, without constraints. Complete the first row of the following table. Suppose that the government forces the monopolist to set the price equal to marginal cost. Complete the second row of the...
What is a natural monopoly? Why is government justified in regulating a natural monopoly?
What is a natural monopoly? Why is government justified in
regulating a natural monopoly?
Illustrate the graph for a natural monopoly. Where is output regulation on the graph?
Illustrate the graph for a natural monopoly. Where is output
regulation on the graph?
1.What is a natural monopoly? Explain with a graph how a regulated natural monopoly sets its...
1.What is a natural monopoly? Explain with a graph how a
regulated natural monopoly sets its price.
2.Draw a graph that shows a monopoly firm making economic profit
in the short run. Be sure your diagram includes the monopolist’s
demand, marginal revenue, average total cost, and marginal cost
curves. Be sure to indicate the profit maximizing output and price.
Are these profits sustainable in the long run?
8. Natural monopoly analysis The following graph shows the demand (D) for electricity services in the...
8. Natural monopoly analysis
The following graph shows the demand (D) for electricity
services in the imaginary town of Utilityburg. The graph also shows
the marginal revenue (MR) curve, the marginal cost (MC) curve, and
the average total cost (ATC) curve for the local electricity
company, a natural monopolist.
On the following graph, use the black point (plus symbol) to
indicate the profit-maximizing price and quantity for this natural
monopolist.
Monopoly Outcome0123456789104036322824201612840PRICE (Cents per
Kilowatt-hour)QUANTITY (Thousands of kilowatt-hours)DMRMCATC
Which of...
Is a monopoly with the following cost curve facing the following demand curve a natural monopoly?...
Is a monopoly with the following cost curve facing the following
demand curve a natural monopoly?
P(Q)=100-5Q
C(Q) = 8,000 + 10 Q2
A.Yes
B. No
C. Cannot be determined from the information provided
Natural Monopoly: Suppose that PG&E is a natural monopoly. PG&E faces the following inverse demand curve...
Natural Monopoly: Suppose that PG&E is a natural
monopoly. PG&E faces the following inverse demand curve for
monthly demand for gas: P=260- 1/4Q. Suppose its marginal and
average variable costs are a constant $10 per kilowatt
hour.
Find the profit maximizing quantity and price if this
natural monopolist was not regulated
Draw a graph for the monopolist, showing the demand
curve, the marginal revenue curve, and the profit maximizing output
and price
Now suppose that the natural monopolist is regulated...
ADVERTISEMENT
ADVERTISEMENT
Latest Questions
- A professional couple wishes to purchase a new home costing $750,000, make a 20 percent down...
- Padre holds 100 percent of the outstanding shares of Sonora. On January 1, 2016, Padre transferred...
- Question: Use backtracking algorithm design to write Java code to solve the subset problem: given a...
- Patsy Ltd. produces ice-cream and would like to accurately forecast sales so that it can meet...
- Power Music owns five music stores, where it sells music, instruments, and supplies. In addition, it...
- 4) A client wants to finance the purchase of a house costing $50,000 over a period...
- [The following information applies to the questions displayed below.] In 2018, Sheryl is claimed as a...
ADVERTISEMENT