Question
In: Psychology
Study 1 tested 921 students at UVA. The researchers asked people to check off how many...
Study 1 tested 921 students at UVA. The researchers asked people to check off how many of the following activities they liked (with a yes/no response). There were three general activities: walking, running, biking. There were three ocean-related activities: swimming, sailing, and kayaking. And there were three mountain-related activities: skiing, rock-climbing, mountain biking. Each person got one score for each category of activities. Each person also filled out a questionnaire called the “Big Five,” which measured their extroversion with 2 items, answered with a 5-point scale.
The reported correlation between extroversion and liking for the ocean was r = .18 (p < .01).
What does the correlation mean in this example? Is this
relationship strong or weak?
Sketch a scatterplot of this correlation on a well-labeled
graph.
What does p < 0.01 mean in this result?
Solutions
Expert Solution
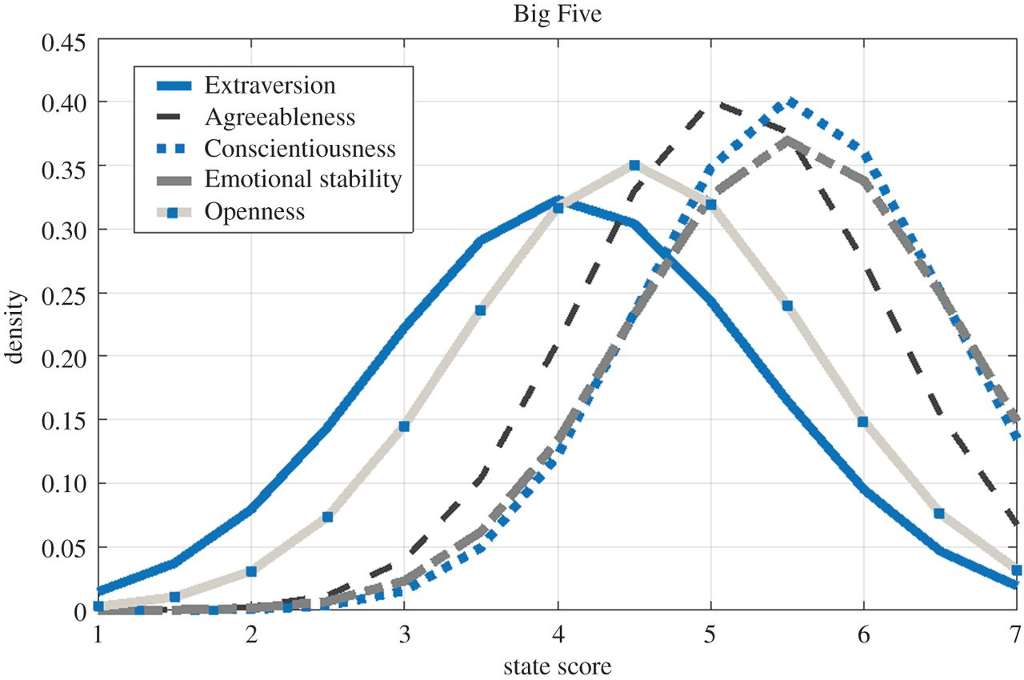
The big five personality test consists of the following scores which consists of several factors like:
- Extraversion.
- Agreeableness.
- Conscientiousness.
- Emotional stability.
- Openess.
The factors are denoted below in the form of a graphical picture representation :
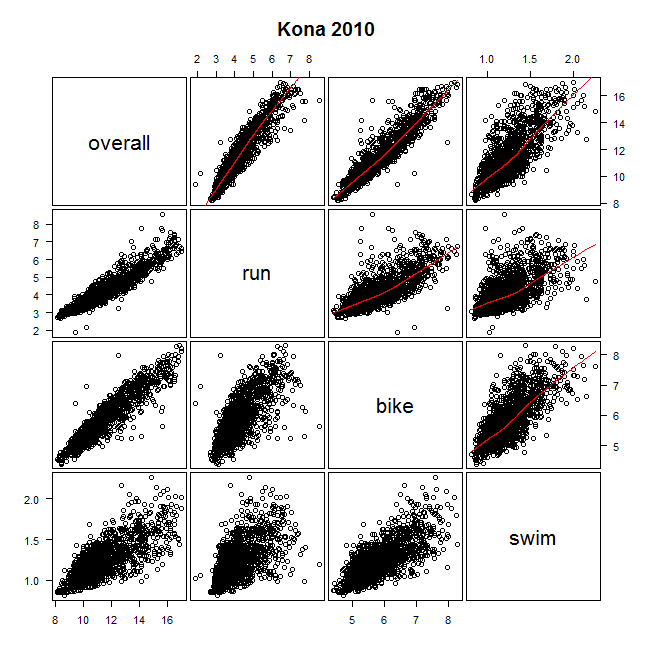
The scatter pot of running, biking, swimming and walking is given below in the form of a figure:
r is the sample correlation coefficient of the data after plotting a graph of the values given in the experimental statistical data.
There are three types of results which can be planned like:
- If r value is significant, the scatter value shows a significant trend. The values of y are calculated provided the x values are wihin the domain limits.
- If scatter plot is not in the form of a linear graph, then the r values are not significant.
- Scatter plot is significant for the x and y values given within the domain range plot analysis.
P<0.01 gives a 1% level of significance. The regression and correlation values are calculated from the linear plot of the available scatter data.
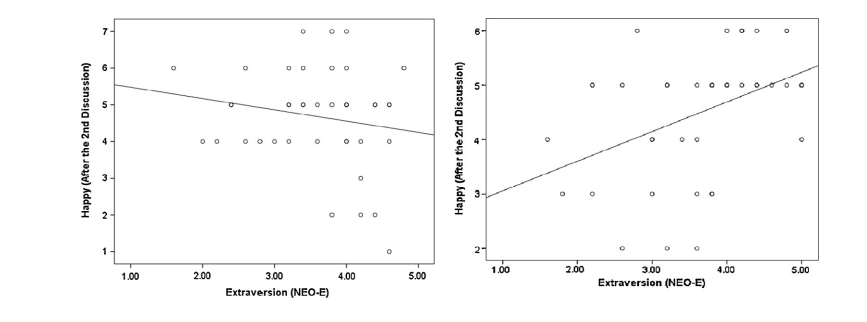
The regression linear graphs of extraversion in the form of scatter plots is depicted below as a figure:
 Hayet Jeridi answered 1 month ago
Related Solutions
Two researchers conducted a study in which two groups of students were asked to answer 42...
Two researchers conducted a study in which two groups of students were asked to answer 42...
Two researchers conducted a study in which two groups of students were asked to answer 42...
A Rutgers University study found that many high school students cheat on tests. The researchers surveyed...
1) A survey was conducted that asked 1002 people how many books they had read in...
Twenty people check their hats at a theater. In how many ways can their hats be...
(a) in how many different ways can a student check off one answer to each question?
1. A university asked 10 graduate students how many hours of homework they were planning to...
In a survey, students are asked how many hours they in a typical week. A five...
Twenty students were surveyed this week at MPC, these students were asked how many units they...
- Write a Bash script called move that could replace the UNIX command mv. 'move' tries to...
- Write program in C language using Pthreads API to simulate the real problem, the Sleeping Teaching...
- HF(g) + H2O(l) = H3O+(aq) + F-(aq) In the following equilibrium in a closed system, indicate...
- : Write a paragraph to reflect on what you have learned about Microsoft access in terms...
- Consider two markets: the market for cat food and the market for dog food. The initial...
- Why is business ethics unavoidable?
- mr. smith completed 9 years of fixed monthly payments of 3,333.28 on a 30 year loan...