Question

In: Accounting

QUESTION 31 The following financial information is given for Du Pont and Dow for fiscal year...

QUESTION 31

  1. The following financial information is given for Du Pont and Dow for fiscal year 2001:

    Du Pont

    Dow

    Closing Stock Price, Feb. 15, 2002

    44.90

    30.57

    EPS (actual for 2001)

    4.50

    -0.46

    EPS (forecast for 2002)

    1.60

    0.52

    Dividend per share

    1.40

    1.34

    5 year forecast earnings growth rate

    10.2%

    10.0%

    Intrinsic value per share

    103.84

    33.38

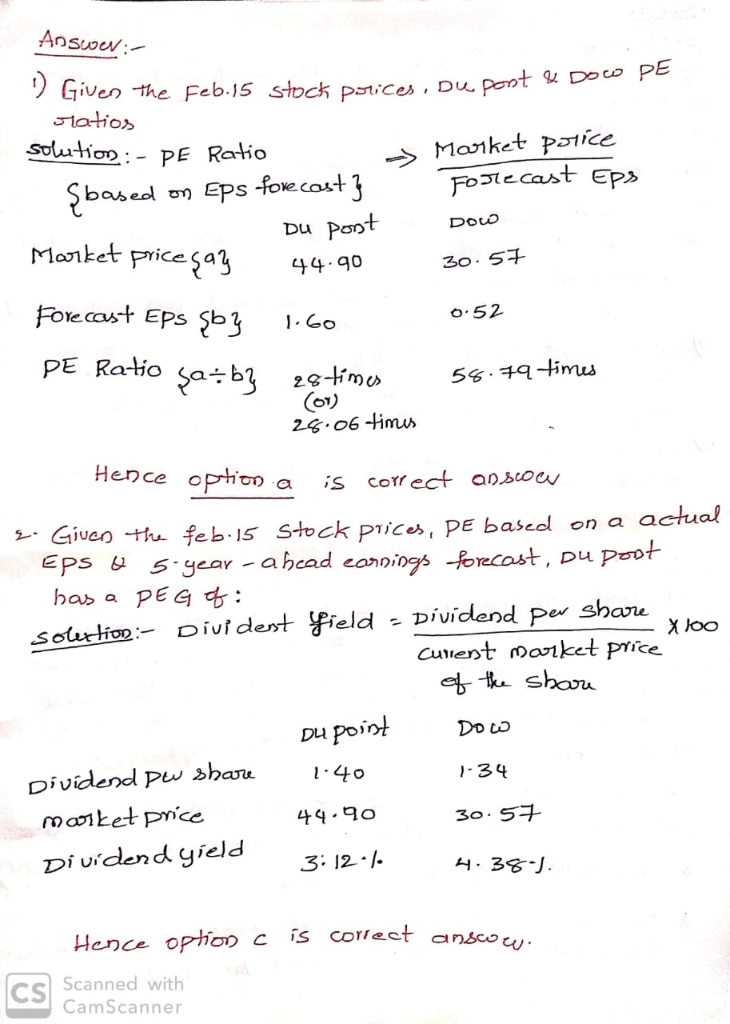
    Given the Feb. 15 stock prices, Du Pont & Dow have PE ratios (based on year-ahead EPS forecast) of:

    a.

    28.06 & 58.79, respectively

    b.

    9.98 & 58.79, respectively

    c.

    28.06 & 66.46, respectively

    d.

    32.07 & 22.81, respectively

  2. Following Question 31, given the Feb. 15 stock prices, Du Pont & Dow have dividend yields of:

    a.

    13.72% & 13.40%, respectively

    b.

    3.56% & 1.70%, respectively

    c.

    3.12% & 4.38%, respectively

    d.

    31.11% & 2.58%, respectively

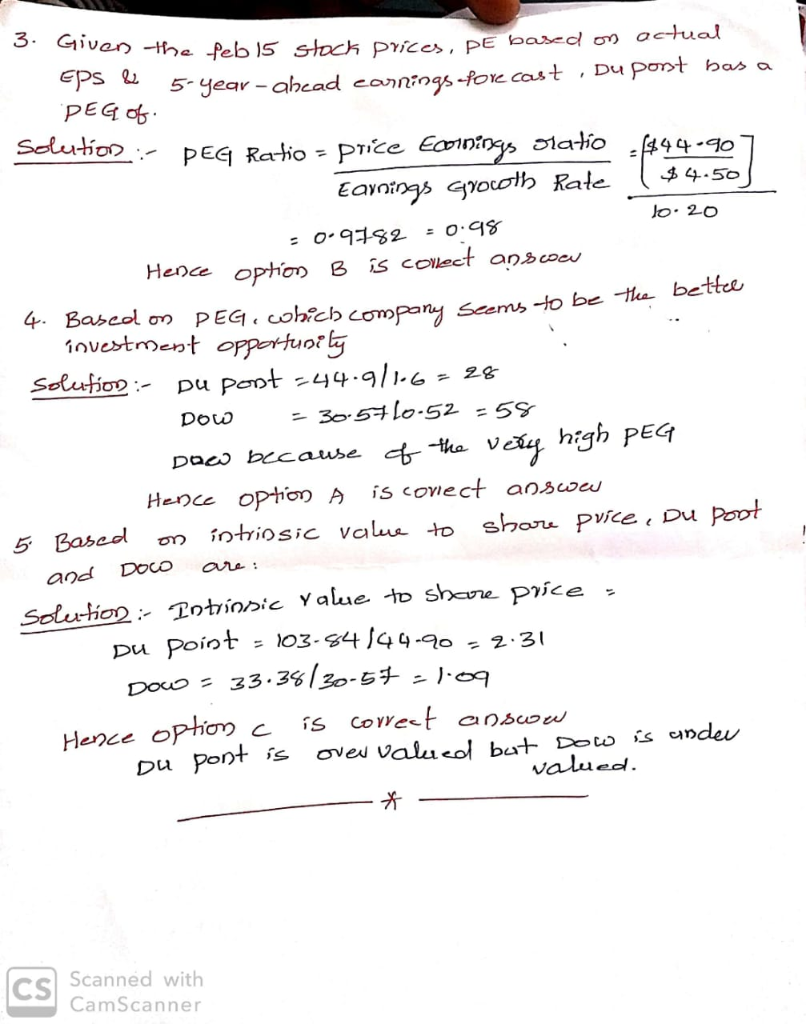
  3. Following Question 31, given the Feb. 15 stock prices, PE based on actual EPS & 5-year-ahead earnings forecast, Du Pont has a PEG of:

    a.

    3.14

    b.

    0.98

    c.

    4.40

    d.

    2.75

  4. Following Question 31, based on PEG, which company seems to be the better investment opportunity?

    a.

    Dow because of the very high PEG

    b.

    Du Pont because of the very high PEG

    c.

    Dow because the PEG is less than the benchmark cutoff of 1

    d.

    Du Pont because the PEG is less than the benchmark cutoff of 1

  5. Following Question 31, based on intrinsic value to share price, Du Pont and Dow are:

    a.

    Du Pont is undervalued but Dow is overvalued

    b.

    Both are undervalued

    c.

    Du Pont is overvalued but Dow is undervalued

    d.

    Both overvalued

Solutions

Expert Solution


Related Solutions

You are asked to perform financial ratio analysis, including the use of Du Pont       equation, to...
You are asked to perform financial ratio analysis, including the use of Du Pont       equation, to analyze the underlying cause for recent deteriorating performance of       East Inc. Based on the information provided below, answer the questions. Income Statement (in $ million)           Net sales                                                   800           Cost of Goods Sold                                          696           Operating Expenses (including income taxes)               80         Net Income                                                            24                   Balance Sheet           Cash and Marketable Securities        45              Account Payable           50           Account Receivable                      90              Short-term Debt           60           Inventory                        160             Accrued Expenses            20           Long-lived Assets                         150            Long-term Debt            25                                                 Stockholder's Equity      290           Total Assets                              445             Liabilities and Equity       445                              Definition of Financial...
Using the Du Pont method, evaluate the effects of the following relationships for the Butters Corporation.  ...
Using the Du Pont method, evaluate the effects of the following relationships for the Butters Corporation.      a. Butters Corporation has a profit margin of 5.5 percent and its return on assets (investment) is 14.5 percent. What is its assets turnover? (Round your answer to 2 decimal places.) b. If the Butters Corporation has a debt-to-total-assets ratio of 65.00 percent, what would the firm’s return on equity be? (Input your answer as a percent rounded to 2 decimal places.) c....
Using the Du Pont method, evaluate the effects of the following relationships for the Butters Corporation....
Using the Du Pont method, evaluate the effects of the following relationships for the Butters Corporation. a. Butters Corporation has a profit margin of 7 percent and its return on assets (investment) is 13 percent. What is its assets turnover? (Round your answer to 2 decimal places.) b. If the Butters Corporation has a debt-to-total-assets ratio of 40.00 percent, what would the firm’s return on equity be? (Input your answer as a percent rounded to 2 decimal places.) c. What...
Using the Du Pont method, evaluate the effects of the following relationships for the Butters Corporation.  ...
Using the Du Pont method, evaluate the effects of the following relationships for the Butters Corporation.      a. Butters Corporation has a profit margin of 6 percent and its return on assets (investment) is 22.25 percent. What is its assets turnover? (Round your answer to 2 decimal places.)       b. If the Butters Corporation has a debt-to-total-assets ratio of 40.00 percent, what would the firm’s return on equity be? (Input your answer as a percent rounded to 2 decimal...
1. Use the following data concerning Grange Barley Company and the Du Pont system in problems...
1. Use the following data concerning Grange Barley Company and the Du Pont system in problems 1 and 2. Net income = $150,000; Sales = $2.4 million; Total asset turnover = 3; and Equity multiplier = 2.5 Grange Barley does not have any preferred stock outstanding. Calculate the return on assets for Grange Barley Company. options: A) 31.25% B) 23.5% C) 18.75% 2. Use the following data concerning Grange Barley Company and the Du Pont system in problems 1 and...
Question 1 Apple has the following financial statement information for fiscal year 2001 (in millions): Income...
Question 1 Apple has the following financial statement information for fiscal year 2001 (in millions): Income Statement 2001 Balance Sheet 2001 2000 Revenues $5,363 Cash and Marketable Securities $2,310 $1,191 Cost of Goods Sold 4,026 Inventory 11 33 Gross Profit 1,337 Total Current Assets 5,143 5,427 SG&A Exp. 1,568 Total Assets 6,021 6,803 Net Income (Net Loss) -25 Total Current Liabilities 1,518 1,933 Total Liabilities 2,101 Total Equity 3,920 4,107 Sales (Year 2000) 7,983 Cash Flow Statement Net Income (Year...
Selected financial information for the Bravo-Zulu Company for the fiscal year ended December 31, 2016 is...
Selected financial information for the Bravo-Zulu Company for the fiscal year ended December 31, 2016 is as follows: Net Income $122,500 Depreciation Expense 50,000 Purchases of plant assets 125,000 Proceeds on Disposals of plant assets 20,000 Loss on Disposal of plant assets 7,500 Accounts receivable increased 2,500 Accounts payable decreased 4,000 Interest expense 5,000 Income tax expense 2,500 Additionally, Bravo-Zulu issued stock in exchange for an outstanding note payable of $72,500. The cash balance on January 1, 2016 was $37,000....
Selected financial information for the Bravo Zulu company for the fiscal year ended December 31, 2016...
Selected financial information for the Bravo Zulu company for the fiscal year ended December 31, 2016 is as follows: Net Income $122,500 Depreciation expense 50,000 Purchases of plant assets 125,000 Disposals of plants assets 20,000 Gain on Disposal of plant assets 7,500 Accounts receivable decreased 2,500 Accounts payable decreased 4,000 Interest expense 5,000 Income tax expense 2,500 Additionally, Bravo-Zulu issued stock in exchange for an outstanding note payable of $72,500. The cash balance on January 1, 2016 was $37,000. The...
Question 1 Chaos Manufacturing had the following financial information for the year ended December 31 2018:...
Question 1 Chaos Manufacturing had the following financial information for the year ended December 31 2018: Inventory Balances:                Beginning                    Ending Work in Progress                    $ 90,000                      $ 80,000 Finished Goods                        $ 77,000                      $ 67,000 Raw Materials                         $ 10,000                      $ 10,000 During the year, the budgeted and actual costs were as follows: Note Budget Actual Raw Materials 1       300,000      290,000 Labour 2       540,000      518,000 Depreciation Factory Equipment        72,000         72,000 Depreciation Office Equipment    ...
The fiscal year 2015 and 2014 financial statements for AT&T's financial statements contained the following information:...
The fiscal year 2015 and 2014 financial statements for AT&T's financial statements contained the following information: Balance Sheets ($ in millions)                                            2015                2014 Current assets: Accounts receivable, net of allowances for doubtful accounts of $704 and $454                                 $16,532           $14,527 Income Statements ($ in millions)                                    2015                2014 Revenues                                                                          $146,801         $132,447 In addition, the statement of cash flows disclosed bad debt expense of $1,416 million in 2015 and $1,032 million in 2014. Calculate the following (must show work below to get credit:...
ADVERTISEMENT
ADVERTISEMENT
ADVERTISEMENT