Question
In: Math
Use R studio to do it I need the code, thx. Write your own function, called...
Use R studio to do it I need the code, thx.
Write your own function, called go_mean(). The user will provide
a vector and the number of repetitions for the simulation. Your
function should:
- Create an empty vector
- Draw a sample the same size as the vector, selecting from the
vector itself, with replacement. - Compute the mean of the vector,
and store it in the empty vector.
- Repeat the steps above n times.
- Compute an 80% confidence interval of the vector of means.
- Print the interval on the console so that it looks something like
this: "Lower limit = value, Upper
limit = value", where the values are rounded to 2 decimal places.
Test your new function by creating a vector of 8000 z scores, and applying your function with 1000 reps
Solutions
Expert Solution
80% confidence interval is level of significance of 
The critical value of z is 
Using standard normal table/R we get the critical value as

If  is the mean of vector of means then 80% confidence interval is
 where
where  is the standard error of mean, which is the sample standard
deviation of vector of means
is the standard error of mean, which is the sample standard
deviation of vector of means
R code to implement all these (all statements starting with # are comments)
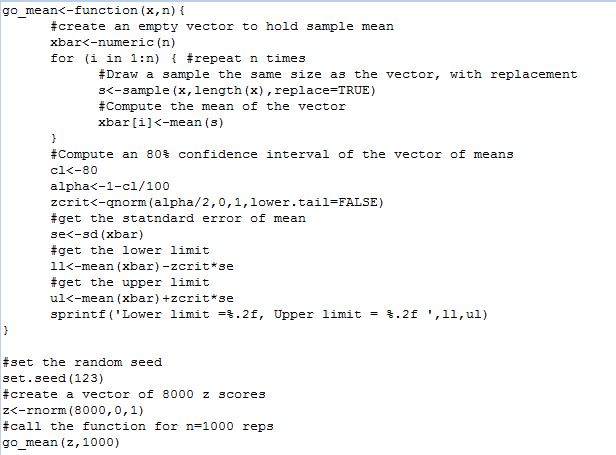
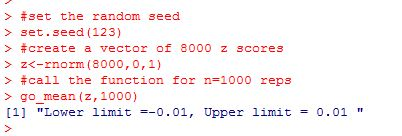
get the following output
Code in text format is below
go_mean<-function(x,n){
#create an empty vector to hold sample mean
xbar<-numeric(n)
for (i in 1:n) { #repeat n times
#Draw a sample the same size as the vector, with replacement
s<-sample(x,length(x),replace=TRUE)
#Compute the mean of the vector
xbar[i]<-mean(s)
}
#Compute an 80% confidence interval of the vector of means
cl<-80
alpha<-1-cl/100
zcrit<-qnorm(alpha/2,0,1,lower.tail=FALSE)
#get the statndard error of mean
se<-sd(xbar)
#get the lower limit
ll<-mean(xbar)-zcrit*se
#get the upper limit
ul<-mean(xbar)+zcrit*se
sprintf('Lower limit =%.2f, Upper limit = %.2f ',ll,ul)
}
#set the random seed
set.seed(123)
#create a vector of 8000 z scores
z<-rnorm(8000,0,1)
#call the function for n=1000 reps
go_mean(z,1000)
 milcah answered 6 months ago
Related Solutions
I need the java code for a 4-function calculator app on android studio (do this on...
I need the java code for a 4 function calculator app on android studio (do this...
Hello, i have this excersice in R studio Write a function in R that generates simulations...
I need the JAVA code for a 4 function calculator app on andriod studio - The...
R studio questions Write up your answers and paste the R code Copy and paste all...
USE R CODING! Pleaseee I need the code With R coding Obs: it supposed to use...
I need the code for following in C++ working for Visual studio please. Thanks Use a...
Write your own R-function for the linear regression using qr() function. You must not use solve()...
In R/ R Studio, what code would I enter to find the answers to these questions?...
1. Use R Studio: Include R Code A survey is taken of 250 students, and a...
- Dirac's Theorem states that "A simple graph with n vertices (n >= 3) is Hamiltonian if...
- Two 10-cm-diameter charged rings face each other, 15cm apart. The left ring is charged to -29nC...
- Under what conditions would it be possible for an excise tax to have no efficiency cost...
- explain the difference between activities and financial statements of service businesses and merchandising businesses.
- 2. Compare and compare the matrix multiplication algorithm and the Floyd-Warshall algorithm to find all pairs...
- Q: 50.00 ml of 0.5216 M copper(II) nitrate solution is combined with 100.0 ml of 0.5580...
- This is a business law question. Explain how environmental laws regulate the use of toxic substances...