Question
In: Economics
1a. Graph the long run position of a firm in monopolistic competition. 1b. Graph the typical...
1a. Graph the long run position of a firm in monopolistic competition.
1b. Graph the typical monopolistic long run situation.
1c. Compare the two graphs and explain how they are similar.
Solutions
Expert Solution
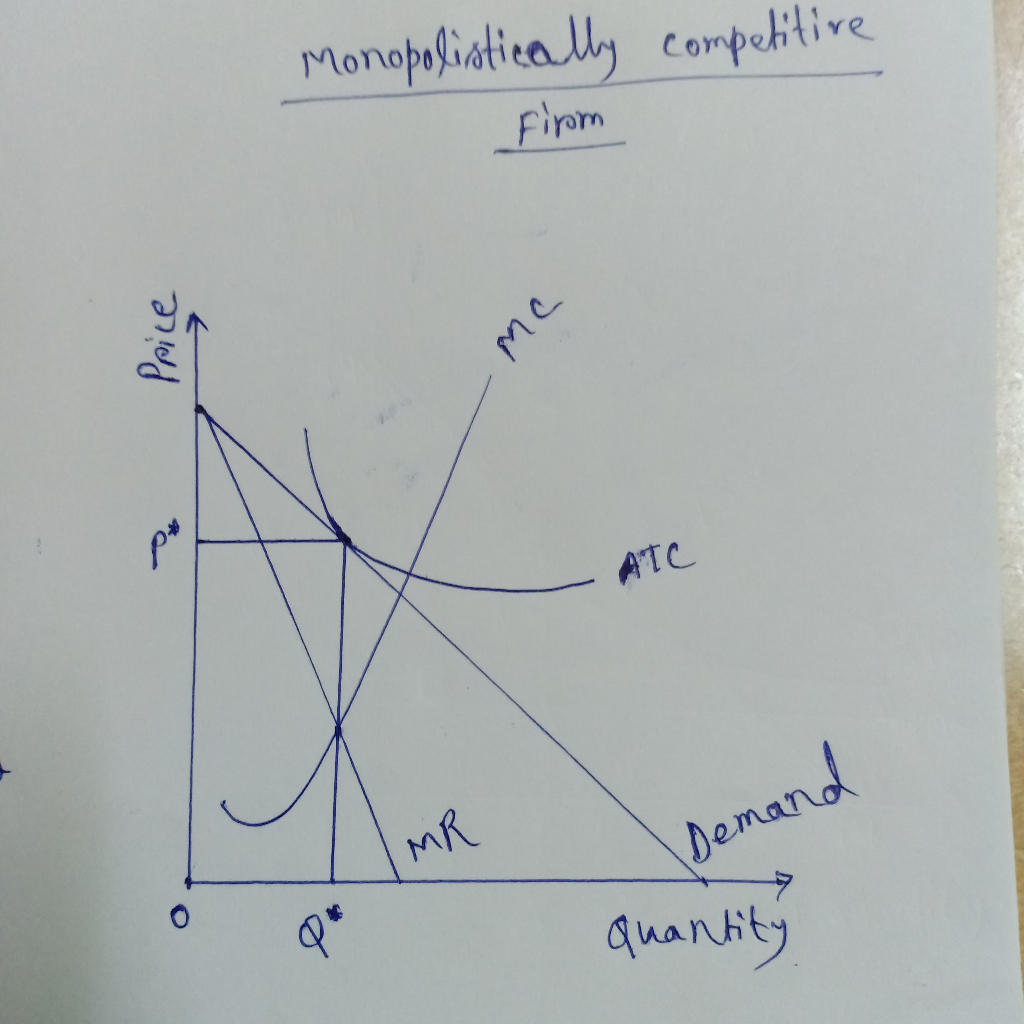
Answer : 1a) The long-run situation of a monopolistically competitive firm is shown by the following picture's diagram. In long-run a monopolistically competitive firm earn zero economic profit.
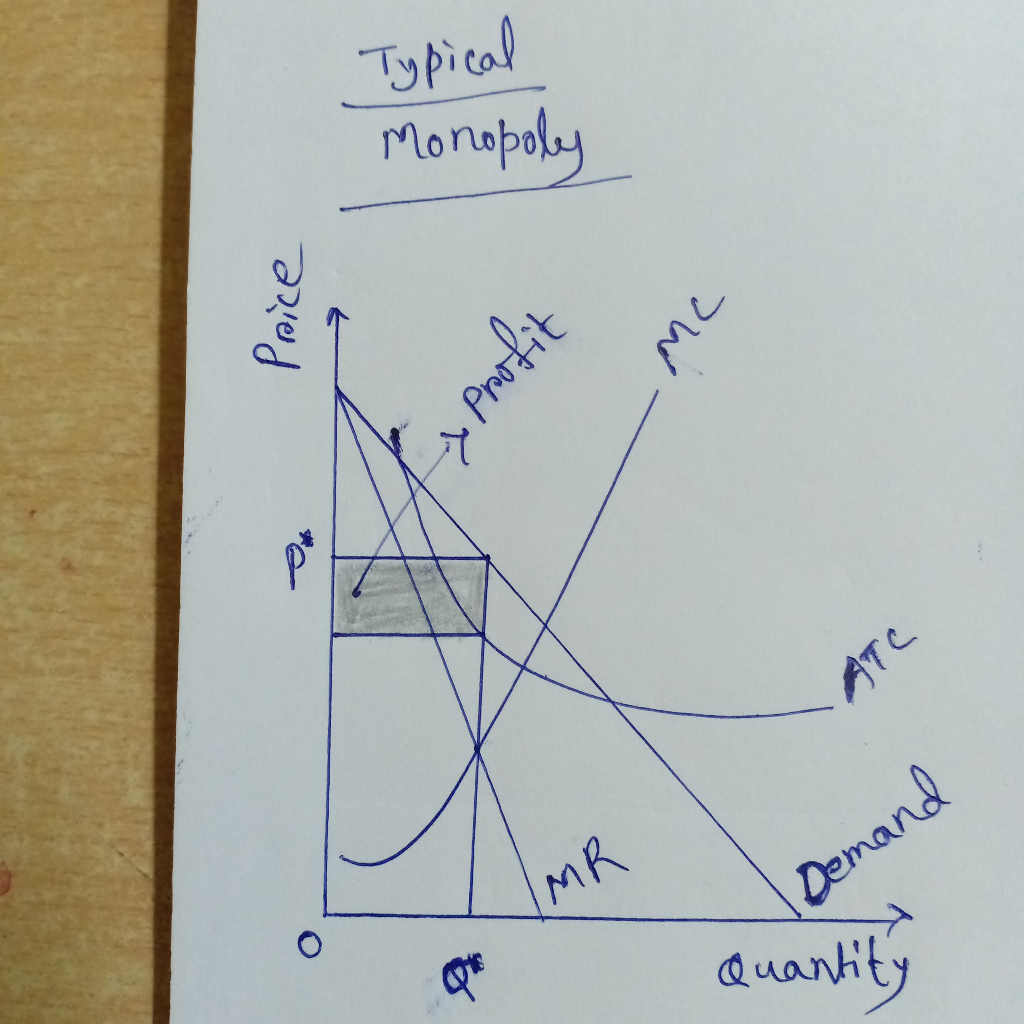
1b) The long-run situation of a typical monopolist is shown by the following picture's diagram. In long-run a typical monopolist earn positive economic profit.
1c) By comparing above two graphs we get some similarities between monopolistically competitive firm's long run situation and a typical monopolist's long run situation. These are following :
i) In both graph the demand curve is downward sloping.
ii) In both graph the MR curve lies below the demand curve.
iii) In both graph the profit-maximizing condition is MR = MC.
iv) In both graph at profit-maximizing output level the price is higher than MC.
v) In both graph the profit-maximizing output level is inefficient.
Thus, both the typical monopolist and a monopolistically competitive firm are similar in long-run.
 Rahul Sunny answered 5 months ago
Related Solutions
What happens in the long run for the monopolistic competition firm and for the oligopoly firm?...
1. In both perfect competition and monopolistic competition, in the long run typical firms earn zero...
Graph and explain in detail the short-run and long-run equilibria under a monopolistic competition situation.
What makes a business successful in monopolistic competition? Provide a short-run profit graph and long-run profit...
Is it true in the long-run, a firm under monopolistic competition has market power but earns...
The long-run profit-maximizing equilibrium of a firm in monopolistic competition in many ways is similar as...
When a profit-maximizing firm in monopolistic competition is producing its long-run equilibrium quantity, A) it will...
Answer the following questions comparing monopolistic competition to perfect competition. a. In the long run, how...
Describe and illustrate the difference between perfect competition and monopolistic competition in the long run. Comment...
Answer the following questions comparing monopolistic competition to perfect competition. I. In the long run, how...
- The output of the function is a dictionary whose keys represent the bins and whose values...
- The shape of a graph of a binomial distribution depends on the value of both n...
- In 2012, cost per Medicare beneficiary did what?
- 3. A. What techniques can a firm use to optimize demand deposit holdings? B. How do...
- The half-life of mercury-197 is 64.1 hours. If a patient undergoing a kidney scan is given...
- Double bonds react with Br2 to form a dibromide. Isobutylene undergoes cationic polymerization under conditions where...
- 1. Which sex chromosomes are limited to only one sex? A. X and Z B. X...