Question
In: Economics
1. Draw the money market with the value of money on the vertical axis and the...
1. Draw the money market with the value of money on the vertical axis and the amount of money on the horizontal axis. For each event below, state the anticipated effect on the price level. (for each part, include a sketch of the shift either in money demand or money supply to support your answer)
a. the Federal Reserve conducts an open-market purchase of bonds from the public
b. consumer confidence is up, and so we see consumers buying more goods and services
c. the interest rate rises inducing households to hold more bonds
b. Draw the Aggregate Demand and Aggregate Supply model in long run equilibrium, with the price level on the vertical axis and real output on the horizontal axis. For each event below, state the effect on the price level and real output in the short run for the US economy. (for each part, include a sketch of the shift either in demand or supply to support your answer)
a. A recession in Canada lowers consumer spending in Canada, who typically holds a trade deficit with the US
b. A new federal tax code lowers the income tax for households
c. Oil prices rise
d. A net inflow of capital which leads to a higher level of capital stock in the domestic economy
Solutions
Expert Solution
Solution to 1
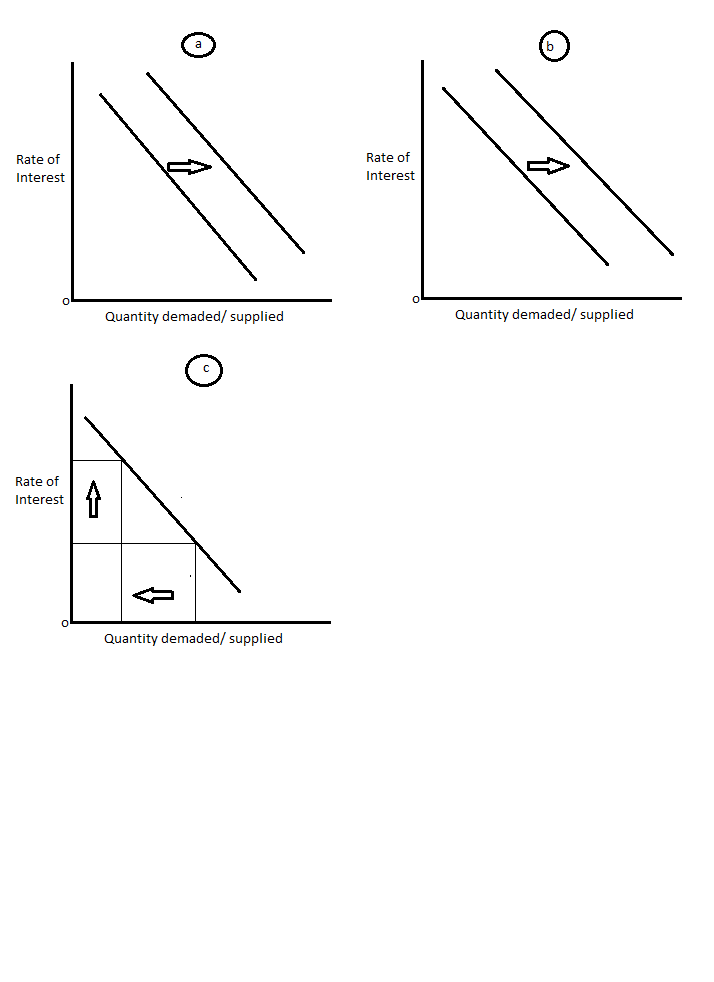
a. the Federal Reserve conducts an open-market purchase of bonds from the public
In this case, the open market purchase creates a demand for money as the speculative demand increases in the market to invest in the bonds. This will hence shift the demand curve fro left to right as show in the below figure.
b. consumer confidence is up, and so we see consumers buying more goods and services
In this case, the purchasing increases the transactional demand for money and hence overall emand increases. The demand curve moves to the right in this scenario
c. the interest rate rises inducing households to hold more bonds
As interest rate increases, the demand for speculation will reduce and the overall demand falls, however this movement is along the demand curve and the curve does not shift. The quantity demanded reduces as shown below.
Solution to 2
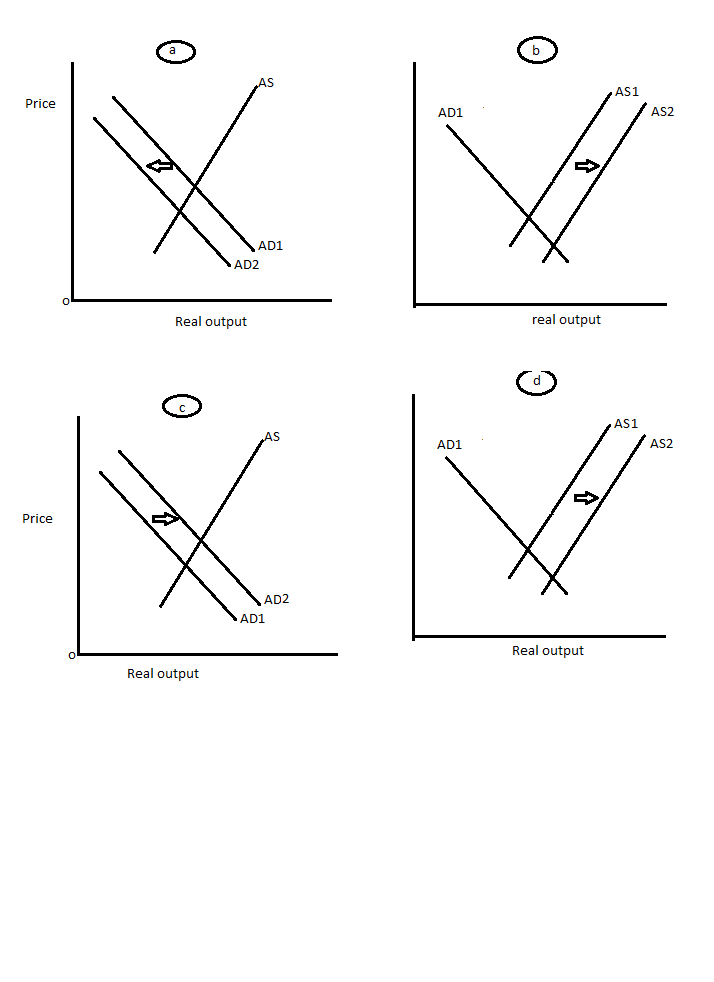
a. A recession in Canada lowers consumer spending in Canada, who typically holds a trade deficit with the US
The reduction in spending will affect the transaction demand for money and the aggregate demand as a whole will fall. This will move the curve to the left and the price will be lesser with lesser real output.
b. A new federal tax code lowers the income tax for households
As the income tax comes down, people have more disposable income at hand and hence the supply of money increases as shown below. This will increase the money supplied and reduce the rate of interest. This will increase real output and reduce the price.
c. Oil prices rise
When the oil prices increase, the demand for money also increases. This will move the demand curve to the right and increase the rate of interest in the market. The price level as well as the real output increases.
d. A net inflow of capital which leads to a higher level of capital stock in the domestic economy
Such a scenario will increase the money supply in the market and will have an effect of increasing the money supplied and reduce the rate of interest. Te price reduces wheras the real output increases
 Rahul Sunny answered 6 months ago
Related Solutions
When the money market is drawn with the value of money on the vertical axis, an...
Draw a graph with leisure on the horizontal axis and income onthe vertical axis. Assume...
Get a sheet of paper and draw a horizontal optical axis. Next, draw a vertical line...
In a labor market graph, _____ is measured on the vertical axis, and _____ is measured...
Draw a money market
Draw a graph with the inflation rate on the Y (vertical) axis and unemployment rate on...
Assume the labor market is in equlibrium (a) With wages on the vertical axis and employees...
In the space below, draw a firm’s isocost/isoquant diagram with K on the vertical axis and...
Suppose labor is on the horizontal axis and capital is on the vertical axis. If the...
4. Draw a firm’s labour demand curve that intersects the vertical axis at $20 per hour,...
- Students performed a procedure similar to Part III of this experiment (Analyzing a Vitamin Supplement for...
- The output of the function is a dictionary whose keys represent the bins and whose values...
- The shape of a graph of a binomial distribution depends on the value of both n...
- In 2012, cost per Medicare beneficiary did what?
- 3. A. What techniques can a firm use to optimize demand deposit holdings? B. How do...
- The half-life of mercury-197 is 64.1 hours. If a patient undergoing a kidney scan is given...
- Double bonds react with Br2 to form a dibromide. Isobutylene undergoes cationic polymerization under conditions where...