Question
In: Statistics and Probability
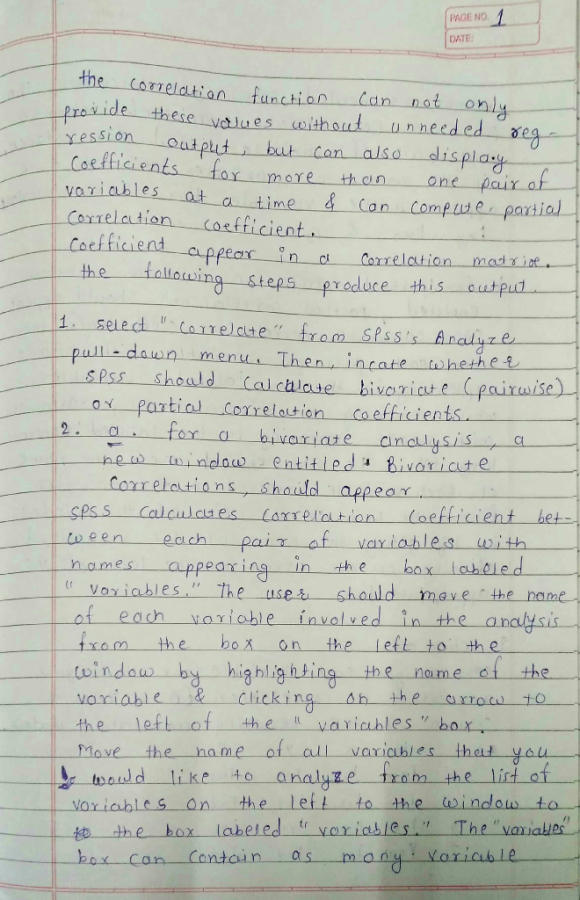
How do I generate a correlation matrix in SPSS, what are the steps?
How do I generate a correlation matrix in SPSS, what are the steps?
Solutions

 orchestra answered 3 years ago
Related Solutions
SPSS: Correlation Use SPSS or Excel to calculate the appropriate correlation coefficient for the following data...
SPSS: Correlation
Use SPSS or Excel to calculate the appropriate correlation
coefficient for the following data for “Hours of Exercise” and
“Life Satisfaction.” (0 = Not at all satisfied). Provide an
APA-style results section write – up. (b) Graph the
relationship.
HINT: Below you will find instructions for the APA-style
write-up.
Complete the write-up on a word document and upload the file
for submission.
Hours of Exercise.
2
0
5
6
1
2
4
4
3
4
life satisfaction...
what is the trace of correlation matrix ? explian in detials please?
what is the trace of correlation matrix ? explian in detials
please?
Using a correlation method, how can I explain scientific method steps to testing the validity of...
Using a correlation method, how can I explain scientific method
steps to testing the validity of the folk wisdom idea saying "the
early bird catches the worm". My theory is "You will have an
advantage and be successful if you start early before anyone else
does". i need at least 100 words. please help me.
How do I conduct a chi square analysis to test in SPSS using the nonparametric test...
How do I conduct a chi square analysis to test in SPSS using the
nonparametric test under the analyze tab
Question 7. The results of the correlation analysis in the Correlation Matrix these variables are depicted...
Question 7. The results of the correlation
analysis in the Correlation Matrix these variables
are depicted below. Use information in the table to discuss the
strength and nature of relationship between the four variables.
Training
Performance
Years of Service
Annual Salary
Training
1
Performance
0.016
1
Years of Service
0.377
-0.268
1
Annual Salary
0.597
0.709
0.286
1
Question 9. Results of the three goodness of
test measures is given in the table below:
Goodness of Fit Tests
R Square...
How do I input this in R studio 1. Combine the following lists into a matrix...
How do I input this in R studio
1. Combine the following lists into a matrix called animals,
where each list becomes a row:
Cats = 2,2,4
Dogs = 1,2,1
Cows = 30,35,41
2. Add column names of “Farm A”, Farm B”, and “Farm C”.
3. Transpose the rows and columns in animals and store the
result to a matrix called farms.
4. Display the contents of farms.
Using excel compute correlation coefficients, correlation matrix and test the significance of the correlation coefficients between...
Using excel compute correlation coefficients, correlation matrix
and test the significance of the correlation coefficients between
sales with price, sales with advertisments using alpha
0.05
Sales
Price
Adver
19.98
14.10
15.19
19.98
18.65
15.19
19.98
18.65
13.87
19.98
18.65
12.83
19.98
18.65
13.16
19.98
18.65
15.19
19.98
18.65
13.92
20.10
18.73
14.42
20.12
18.75
13.83
20.13
18.75
14.50
20.14
18.75
13.87
20.12
18.75
13.64
20.12
13.87
14.31
20.13
14.27
13.85
20.14
18.76
14.20
20.14
18.77
13.64
20.13
13.87
14.33
20.13
14.14...
How do I upload the Dataset in order for you to answer the following questions? Generate...
How do I upload the Dataset in order for you to answer the
following questions?
Generate a bivariate display in SPSS or PSPP for the DEGREE
variable with each of the other attitude variables (you will have
two tables). Then answer the questions below. Q3a: The majority of
those with a Graduate degree reported what level of confidence in
the military? Report the category for conarmy and the associated
percentage. Category _______________ Percentage_____________
What are the steps in completing the accounting cycle? How do the different steps affect the...
What are the steps in completing the accounting cycle? How do
the different steps affect the financial statements? What is the
effect on the financial statements of missing a step when
completing the accounting cycle? How do these steps play a roll in
accrual basis accounting?
In general, how do you draw lewis structures? What are the steps and then how do...
In general, how do you draw lewis structures? What are the steps
and then how do you draw the structure based on what you are given?
Sorry if this is confusing, I am very confused on how I draw the
structure given a molecule etc.. This is for basic chemistry.
ADVERTISEMENT
ADVERTISEMENT
Latest Questions
- Do you think that CAFTA will have a major impact on the U.S. economy? Why?
- Assignment 4, Fraction Comparable Instructions For this assignment, you will be updating the Fraction class from...
- what crystal claim that English is doing across the world?
- Site map for your e-commerce site. How many webpages this site has? What’s the name of...
- A skier of mass 60 kg starts at the top of a steep slope with an...
- If banks must hold $4 in reserves for each $10 in deposits, and the public decides...
- A 244 g mass is hung on a spring. As a result the spring stretches 20.5...
ADVERTISEMENT