Questions
There is an investment that returned 7.6% while having a 7.4 PE ratio and a risk...
There is an investment that returned 7.6% while having a 7.4 PE ratio and a risk evaluation of 1. Estimate the return on this investment assuming its 7.4 PE ratio and Risk evaluation of 1. What is the residual compared to the actual 7.6 return? |PE Ratio Risk Return |7.4 1.0 7.6 11.1 1.3 13.0 8.7 1.1 8.9 11.2 1.2 10.9 11.6 1.7 12.1 12.2 1.3 12.8 12.5 1.2 11.3 12.5 1.3 14.1 13.0 1.6 14.8 13.4 1.4 16.7
PLEASE SHOW STEPS AND BASIC FORMULAS USED FOR EQUATIONS AND CALCULATIONS.PREVIOUS CHEGG ANSWER CANNOT BE COMPREHENDED.
In: Finance
Generate and provide your answers to ALL questions using a Microsoft Excel Worksheet(s) and submit this...
Generate and provide your answers to ALL questions using a Microsoft Excel Worksheet(s) and submit this Worksheet as a separate document with your Word document file.
Note: You may answer this question in two or more Excel Worksheets – one Worksheet containing the table and the other Worksheet containing all the plots. Alternatively, you may choose to provide each plot in a separate Worksheet.
Demonstrate how the spectral emissive power inside a blackbody cavity changes with respect to the following parameters:
Temperature and wavelength, hence, find Eλ(λ, T), by:
a) Creating a table with the (λ, T) values as follows:
1. Wavelengths, λ, from 0.1 μm to 100 μm, on the first (left-most) column. Use increments of:
→ 0.1 μm from 0.1 μm to 1.0 μm;
→ 0.5 μm from 1.0 μm to 10 μm;
→ 1.0 μm from 10 μm to 100 μm;
2. Temperatures, T, values of: 293.15 K; 793.15 K; 1293.15 K; 1793.15 K; 2293.15 K; 7500 K; and, 12000 K.
3. Calculate Eλ(λ, T) using units of W/m2·μm and assume the constants C1 = 374210000 and C2 = 14388.
Set up your table with each separate column corresponding to each given value of T. Ensure that you clearly label each column in your table and include the relevant units.
[Hint: There should be seven separate columns in your table for the Eλ(λ, T) calculations and eight columns in your table altogether with the inclusion of the left-most column consisting of the λ values.
The recommendation is that you fill in each separate column in your table using a different background colour in order to facilitate the examination of the different T calculations and to assist in identifying the corresponding plots.]
4. Clearly demarcate the visible region in your table. You may do this by selecting a different coloured font for the values of λ (and the corresponding Eλ values) that fall within this region.
b) Plot the calculated values of Eλ(λ, T) ensuring that you set out each plot as follows:
1. Display the calculated Eλ(λ, T) values on the vertical axis.
2. Display the wavelengths on the horizontal axis. Select the logarithmic scale, to base 10, to display your values on this axis.
3. Clearly demarcate the visible region in each plot.
4. Include a title in each plot, clearly identifying the relevant value of T and ensure that you label both axes (including units).
[Hint: The recommendation is that you fill in the background of each plot in the same colour as the corresponding column in your table in order to facilitate the analyses of the different T calculations.]
In: Physics
Betas: Stock Volatility Conceptual Overview: Explore how stock volatility relates to the beta coefficient b risk...
Betas: Stock Volatility
Conceptual Overview: Explore how stock volatility relates to the beta coefficient b risk measure.
The tendency of a stock to move with the market is measured by its beta coefficient, b. When first loaded, the graph shows the line for an average stock, which necessarily matches the market return. In a year when the market returns 10%, the average stock returns 10%. And in a year when the market goes down -10%, the average stock goes down -10% also. The slope of the line for the average stock is b = 1.0. A more volatile stock would change more extremely. Drag the line vertically so that it has a slope of b = 2.0. For this more volatile stock, in a year when the market returned 20%, the volatile stock did better with a 30% return, and when the market lost -10%, the volatile stock lost big with a -30% change. Now drag the line so that it has a slope of b = 0.5. This stock is less volatile than the average stock and reacts less extremely than the market. In a year the market returned 20%, the less volatile stock returned slightly less at about 15%. And in a year when the market lost -10%, the less volatile stock did a letter better with a 0% "return."
There are two simple principles:
- The larger the beta coefficient b (i.e., the steeper the slope), the more volatile the returns from the stock.
- Beta coefficients b greater than 1.0 indicate the stock is more volatile than average and slopes less than 1.0 indicate the stock is less volatile than average.
For a stock with a beta coefficient of b = 1.50, it is:
- more volatile than the average stock.
- about the same volatility of an average stock.
- less volatile than the average stock.
- Cannot determine.
-Select-abcdItem 1
2. For a stock with a beta coefficient of b = 1.50, in a year when the market return is 20%, we expect, in this particular example, the stock's return to be:
- about 20%.
- about 25%.
- about 30%.
- not enough information to determine.
-Select-abcdItem 2
3. For a stock with a beta coefficient of b = 1.50, in a year when the market return is -10%, we expect, in this particular example, the stock's return to be:
- about 0%.
- about -10%.
- about -20%.
- about -30%.
-Select-abcdItem 3
4. For a stock with a beta coefficient of b = 0, which of these statements is true in this particular example?
- The line in the graph is flat
- It is like a riskless asset with a guaranteed return of 10% no matter what the market does
- There is no chance of lower performance than the market but also no chance of better performance.
- All of the above.
In: Finance
Code in C++ Must show: unit testing ------------------------------------ UsedFurnitureItem Create a class named UsedFurnitureItem to represent...
Code in C++
Must show: unit testing
------------------------------------
UsedFurnitureItem
- Create a class named UsedFurnitureItem to represent a used furniture item that the store sells.
- Private data members of a
UsedFurnitureItem are:
- age (double) // age in years – default value for
- brandNewPrice (double) // the original price of the item when it was brand new
- description (string) // a string description of the item
- condition (char) // condition of the item could be A, B, or C.
- size (double) // the size of the item in cubic inches.
- weight (double) // the weight of the item in pounds.
- Private member functions of a
UsedFurnitureItem object are
- double CalculateCurrentPrice( ): Current price depends on age, brandNewPrice, and condition of the used furniture Item. If the item is in A-condition, the current price will go down by extra 10% of the brandNewPrice for each year of its age until 7 years (e.g., After the first year, and item with a $100 brandNewPrice will cost $90, after 2 years, $ 80, and so on). If the age is greater than 7 years, the price is fixed at 30% of the brandNewPrice. The current price of B-condition items goes down by extra 15 % of the brandNewPrice for each year until the 5th year. After that, the current price is fixed at 20% of the brandNewPrice. Items with C-condition are priced at 10% of the brandNewPrice regardless of age.
-
- double CalculateShippingCost( ): Shipping cost of a UsedFurnitureItem depends on weight, size, and distance. While weight and size are member variables, shipping distance is provided as an additional argument to this function. Shipping rate is 1 cent per mile for items that are smaller than 1000 cubic inches and smaller than 20 pounds. Items with larger size or weight cost 2 cents per mile.
- Public member functions of a
UsedFurnitureItem
- Constructors – default and overloaded [default values: age = 1.0, brandNewPrice = 10.00, description = “Not available”, condition = ‘A’, size = 1.0, weight = 1.0]
- Accessors (getters)
-
- Mutators (setters) – You should ensure that invalid (zero or negative) values do not get assigned to age, brandNewPrice, size or weight data members. An invalid character (other than ‘A’, ‘B’ or ‘C’) should not be allowed to be assigned
-------------------------------------
Test Program:
The test program will test each setter (for objects of both types in a sequence) by calling the setter to set a value and then call the corresponding getter to print out the set value. This test should be done twice on data members that could be set to invalid values (that have numerical or character data type) – once after trying to set invalid values and subsequently, once after setting them to valid values. The data members with string data types (model, description) can be tested just once.
In: Computer Science
You are a nurse on a floor with only elderly patients. Every day, each patient tells...
In: Nursing
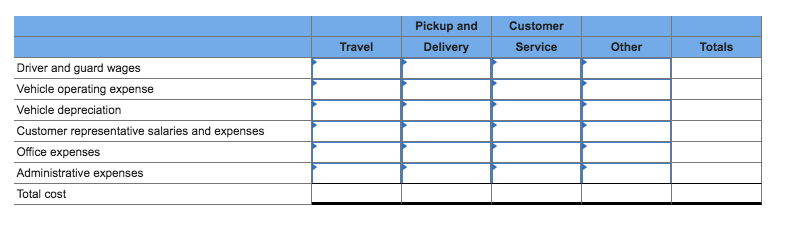
SecuriCorp operates a fleet of armored cars that make scheduled pickups and deliveries in the Los Angeles area.
SecuriCorp operates a fleet of armored cars that make scheduled pickups and deliveries in the Los Angeles area. The company is implementing an activity-based costing system that has four activity cost pools: Travel, Pickup and Delivery, Customer Service, and Other. The activity measures are miles for the Travel cost pool, number of pickups and deliveries for the Pickup and Delivery cost pool, and number of customers for the Customer Service cost pool. The Other cost pool has no activity measure because it is an organization-sustaining activity. The following costs will be assigned using the activity-based costing system:

The distribution of resource consumption across the activity cost pools is as follows:

Required :
Complete the first stage allocations of costs to activity cost pools.
In: Accounting
Two fuel additives are being tested to determine their effect on gasoline mileage. Seven cars were...
Two fuel additives are being tested to determine their effect on gasoline mileage. Seven cars were tested with additive 1 and nine cars were tested with additive 2. The following data show the miles per gallon obtained with the two additives.
| Additive 1 | Additive 2 |
|---|---|
| 17.3 | 17.7 |
| 17.4 | 18.8 |
| 20.1 | 21.3 |
| 15.7 | 20.0 |
| 18.2 | 22.1 |
| 17.6 | 19.7 |
| 17.5 | 18.8 |
| 19.7 | |
| 21.2 |
Use α = 0.05 and the MWW test to see whether there is a significant difference between gasoline mileage for the two additives.
Find the value of the test statistic:
W = ?
Find the p-value. (Round your answer to four decimal places.):
p-value = ?
In: Statistics and Probability
1. The Eco-Marathon is an annual competition sponsored by Shell Oil, in which participants build special...
In: Computer Science
2 large retail companies (W and T) are compared on a Census variable, percent of people who own their home within 3 square miles of the store.
USE SAS OR R IF SOFTWARE IS NECESSARY
2 large retail companies (W and T) are compared on a Census variable, percent of people who own their home within 3 square miles of the store. The percent that own their home for W is:
84, 79, 73, 81, 74, 77, 64, 78, 78, 78, 61
Percent for T is:
58, 61, 57, 62, 61, 59, 56, 64, 61, 70.
- Estimate the difference in percent owning their home for the two companies as to central tendency using lambda=.05. In estimating the difference, use 1 parametric approach, 1 robust(trimming) or nonparametric approach, and the best bootstrapping approach(not jackknife). Make a case for which approach is best.
In: Statistics and Probability