Questions
Will Aps replace textbooks? Using the models discussed in class, 1) construct 5 pro and 5 con arguments. 2) Based on your arguments, take a position on the question. Provide your justification.
Information Technology:
Will Aps replace textbooks? Using the models discussed in class, 1) construct 5 pro and 5 con arguments. 2) Based on your arguments, take a position on the question. Provide your justification.
Note: In the case you make, be sure to discuss class models – Rich/Lean, Diffusion of Innovation, Use Diffusion, Sense-Making/Information Politics; you should use contingency statements that will predict the future success or failure (revenue generation and profitability). These are “if/then” statements: for example, “If these things occur, then the textbook’s future is bleak.” “If these things occur, then textbook’s future is bright.” You will also need to include a description of what types of information you would need to enable you to determine the technology’s future.
In: Computer Science
In 2008, one of the largest financial crises since the stock market crash -- along with...
In 2008, one of the largest financial crises since the stock market crash -- along with resulting failures of several large banks -- was met with a massive intervention in the financial markets by the Federal Reserve and the federal government. The problem was associated with a financial "innovation" in which large numbers of mortgages were “bundled” into a security and sold in the financial markets to banks, investors, foreigners, and investment banks. The problem of excessive risk and moral hazard by home buyers was said to be solved because each of these “securities” represented large numbers of mortgages so that the default on a few of them would have little effect on the underlying value of the “security.”
How could such a system lead to a problem of moral hazard on the part of lenders? What would be a constructive way to solve this challenge?
In: Economics
A farmer pays $0.20 for seed that he uses to grow wheat which he sells to...
-
A farmer pays $0.20 for seed that he uses to grow wheat which he sells to the miller for $0.40; the miller makes wheat flour and sells it to the baker for $0.60. The baker makes bread and sells it to the grocery store for $0.80 and the store sells it to the consumer for $1.00. The total contribution to the Gross Domestic Product (GDP) from all these transactions is
A. $3.00
B. $2.00
C. $1.00
D. $0.20
2-
There has been some concern in the United States that people are NOT saving enough. This is a concern because
A. decreases in saving lead to increases in innovation.
B. decreases in saving lead to decreases in investment.
C. decreases in saving lead to decreases in labor productivity.
D. decreases in saving lead to increases in consumption in the futur
In: Economics
In the movie The Lorax 2012, How did profit maximization play a role in the destruction...
In the movie The Lorax 2012, How did profit maximization play a role in the destruction of the trees? Describe at least two examples of innovation in that we see in the movie. Explain the role of advertising in the movie. How did advertising impact market outcomes? Describe at least two examples of a moral hazard that we see in the movie. What role does a moral hazard play in economics? Would you anticipate that price elasticity for demand for O'Hare Air is elastic, inelastic or unitary elastic and why? Describe at least two ways the government could have or should have intervened in the economy to change the market outcomes of having not trees and dirty air. Why didn’t the government intervene in the market to “fix” these issues?
In: Economics
First, watch Igniting Creativity to Transform Corporate Culture. This TED Talk by Catherine Courage examines how...
First, watch Igniting Creativity to Transform Corporate Culture. This TED Talk by Catherine Courage examines how creativity needs to be infused into the organizational culture to foster innovation and to challenge the status quo. Next, watch this Zappos Company Culture video. As you watch the videos, think about the various elements of effective organizational structure. In your initial post, answer the following questions:
Do you think the unique culture of Zappos will help or hurt the company in the long run? Explain and provide specific examples, where applicable.
Do you think more companies in the future will follow this model? Why or why not?
In your opinion, what company today could benefit from this unique strategy? Explain your rationale.
In: Operations Management
If we are building application that provides service for drivers. I want financial analysis of the...
In: Finance
Suppose that BYOB charges $2.50 per can
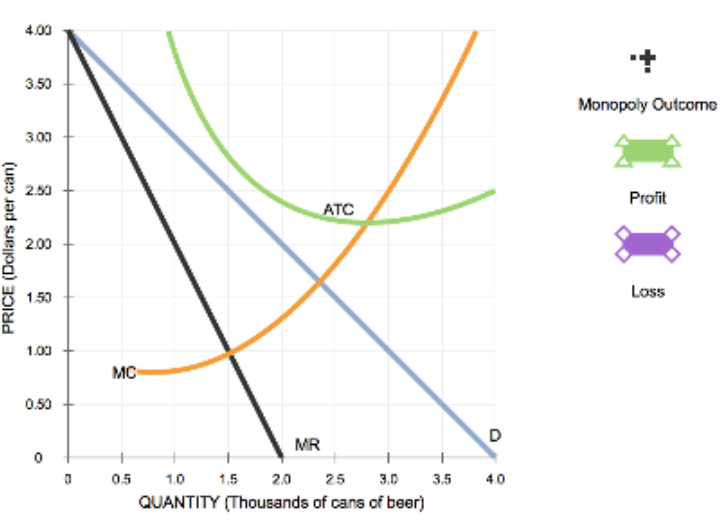
Profit maximization and loss minimization
BYOB is a monopolist in beer production and distribution in the imaginary economy of Hopsville. Suppose that BYOB cannot price discriminate; that is, it sells its beer at the same price per can to all customers. The following graph shows the marginal cost (MC), marginal revenue (MR), average total cost (ATC), and demand (D) for beer in this market.
Place the black point (plus symbol) on the graph to indicate the profit-maximizing price and quantity for BYOB. if BYOB is making a pront, use the green rectangle (triangle symbols) to shade in the area representing its profit. On the other hand, If BYOB is suffering a loss, use the purple rectangle (diamond symbols) to shade in the area representing its loss.
Suppose that BYOB charges $2.50 per can. Your friend Sean says that since BYOB is a monopoly with market power, it should charge a higher price of $3.00 per can because this will increase BYOB's profit.
Complete the following table to determine whether Sean is correct.
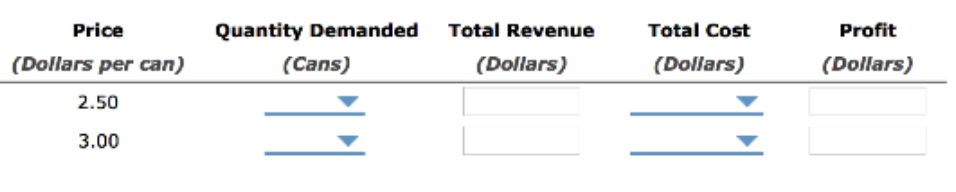
Given the earlier information, Sean _______ correct in his assertion that BYOB should charge $3.00 per can.
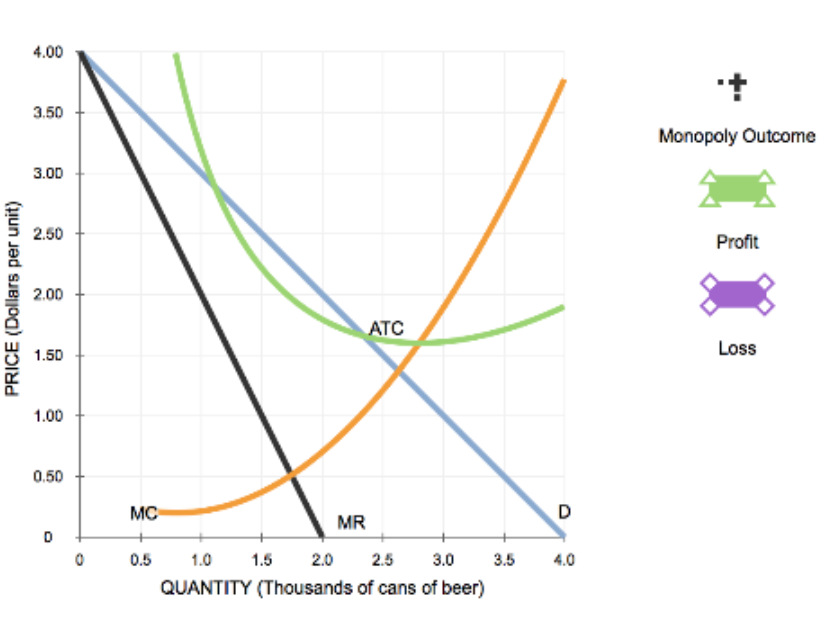
Suppose that a technological innovation decreases BYOB's costs so that it now faces the marginal cost (MC) and average total cost (ATC) given on the following graph. Specifically, the technological innovation causes a decrease in average fixed costs, thereby lowering the ATC curve and moving the MC curve.
Place the black point (plus symbol) on the following graph to indicate the profit-maximizing price and quantity for BYOB. IF BYOB is making a profit, use the green rectangle (triangle symbols) to shade in the area representing its profit. On the other hand, If BYOB is suffering a loss, use the purple rectangle (diamond symbols) to shade in the area representing the loss.
In: Economics
3. Profit maximization and loss minimization BYOB is a monopolist in beer production and distribu...


In: Economics
Why do you think there is oftentimes a mismatch between dynamic cities and dynamic economies? I...
Why do you think there is oftentimes a mismatch between dynamic cities and dynamic economies?
I have a lot of family that lives in the Dallas-Fort Worth Area. No offense to the good people of North Texas, but DFW is not exactly the most livable place in America. The summers there are very hot and humid and the winters are cold and rainy but without snow. It's spread out, hard to navigate, and poor public transport. Houston, San Antonio, and Austin are all more culturally vibrant cities within the state of Texas. Sports in that city consist of talking so much about the 90s Cowboys that you wouldn't know they had four other sports teams that are fairly successful. There's some fun things to do, Six Flags and the Texas State Fair are a good time, but ask yourself, when you think of iconic American cities, does Dallas ever come to mind.
Despite this, DFW is one of the richest cities on earth. They have more millionaires than New York and have been one of the biggest hubs of innovation, finance, petroleum, transportation, and several other industries not just in the US, but worldwide for the past 40 years.
As mentioned in Chapter Six of New Geography of Jobs, there's oftentimes a mismatch between cities that are live-able and culturally vibrant, and those that become major hubs of innovation. Moretti sights Berlin as one of Europe's most interesting cities, but also as one with few jobs and high unemployment. Here in the US, cities such as Albuquerque, New Orleans, and Baltimore are far more interesting than Dallas, but struggle economically.
Why does this occur? Shouldn't firm be more interested in locating in more interesting places that workers would be attracted to, or are the dynamics of labor geography simply too multi varied and unpredictable to explain why Dallas is an economic hub and New Orleans is not.
In: Economics
BYOB is a monopolist in beer production and distribution in the imaginary economy of Hopsville. Suppose that BYOB cannot price discriminate; that is, it sells its beer at the same price per can to all customers.
4. Profit maximization and loss minimization
BYOB is a monopolist in beer production and distribution in the imaginary economy of Hopsville. Suppose that BYOB cannot price discriminate; that is, it sells its beer at the same price per can to all customers. The following graph shows the marginal cost (MC), marginal revenue (MR), average total cost (ATC), and demand (D) for beer in this market.
Place the black point (plus symbol) on the graph to indicate the profit-maximizing price and quantity for BYOB. If BYOB is making a profit, use the green rectangle (triangle symbols) to shade in the area representing its profit. On the other hand, if BYOB is suffering a loss, use the purple rectangle (diamond symbols) to shade in the area representing its loss.

Suppose that BYOB charges $2.75 per can. Your friend Paolo says that since BYOB is a monopoly with market power, it should charge a higher price of $3.00 per can because this will increase BYOB's profit.
Complete the following table to determine whether Paolo is correct.

Given the earlier information, Paolo _______ correct in his assertion that BYOB should charge $3.00 per can.
Suppose that a technological innovation decreases BYOB's costs so that it now faces the marginal cost (MC) and average total cost (ATC) given on the following graph. Specifically, the technological innovation causes a decrease in average fixed costs, thereby lowering the ATC curve and moving the MC
curve.
Place the black point (plus symbol) on the following graph to indicate the profit-maximizing price and quantity for BYOB. If BYOB is making a profit, use the green rectangle (triangle symbols) to shade in the area representing its profit. On the other hand, if BYOB is suffering a loss, use the purple rectangle (diamond symbols) to shade in the area representing the loss.

In: Economics