Questions
In 2017, NB Inc.'s federal taxable income was $242,000. Compute the required installment payments of 2018...
In 2017, NB Inc.'s federal taxable income was $242,000. Compute the required installment payments of 2018 tax in each of the following cases: NB’s 2018 taxable income is $593,000. NB’s 2018 taxable income is $950,000. NB’s 2018 taxable income is $1,400,000.
In: Accounting
A firm's Net Property, Plant & Equipment balance is $14,300,000 on January 1, 2018 and $12,850,000...
A firm's Net Property, Plant & Equipment balance is $14,300,000 on January 1, 2018 and $12,850,000 on December 31, 2018. The firm's Accumulated Depreciation balance is $4,500,000 on January 1, 2018 and $5,650,000 on December 31, 2018. What is the net purchases or net sales of Property, Plant and Equipment in 2018?
Multiple Choice
-
$1,450,000 net purchase
-
$1,450,000 net sale
-
$300,000 net sale
-
$300,000 net purchase
In: Finance
For the year ended 30 June 2018, Alexander Ltd recognised a liability ‘revenue received in advance’...
For the year ended 30 June 2018, Alexander Ltd recognised a liability ‘revenue received in advance’ of $18 000. This revenue was assessable in the year ended 30 June 2018.
Required
(a) What is the carrying amount of the liability on 30 June 2018?
(b) What is the tax base of the liability on 30 June 2018?
(c) If the tax rate is 30%, what would be the deferred tax asset or liability associated with this liability on 30 June 2018?
(d) How would your answers to (a), (b) and (c) above be different if the revenue was assessable in the 2018/2019 financial year?
In: Accounting
Horner Construction Co. uses the percentage-of-completion method. In 2018, Horner began work on a contract for...
Horner Construction Co. uses the percentage-of-completion
method. In 2018, Horner began work on a contract for
$22,000,000; it was completed in 2019. The following cost data
pertain to this contract for the year-ended 2018... Cost incurred
during the year: $7,800,000... Estimated costs to complete:
$5,200,000. The following cost data pertain to this contract for the
year-ended 2019... Cost incurred during the year: $5,600,000...
Estimated costs to complete: n/a. If the completed-contract method
of accounting was used, the amount of gross profit (loss)to be
recognized for years 2018 and 2019 would be
a. 2018: $9,000,000... 2019: $ 0
b. 2018: $8,600,000... 2019: ($400,000)
c. 2018: $ 0... 2019: $8,600,000
d. 2018: $ 0... 2019: $9,000,000
In: Accounting
Accounting Equation Inspirational Inc. is a motivational consulting business.
Accounting Equation Inspirational Inc. is a motivational consulting business. At the end of its accounting period, October 31, 2017, Inspirational has assets of $5,250,000 and habilities of $1,600,000. Using the accounting equation and considering each case independently, determine the following amounts:
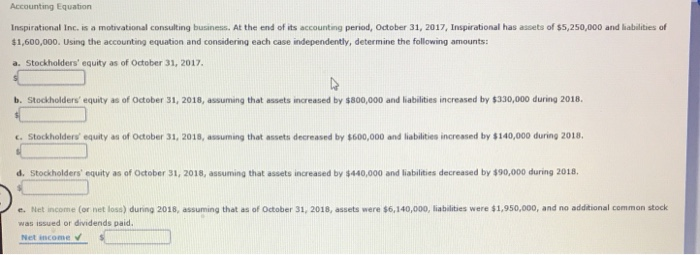
a. Stockholders' equity as of October 31, 2017.
b. Stockholders' equity as of October 31, 2018, assuming that assets creased by $800,000 and liabilities increased by $330,000 during 2018.
c. Stockholders equity as of October 31, 2018, assuming that assets decreased by $600,000 and liabilities increased by $140,000 during 2018.
d. Stockholders' equity as of October 31, 2018, assuming that assets increased by $440,000 and liabilities decreased by $90,000 during 2018
e. Net income (or net loss) during 2018, assuming that as of October 31, 2018, assets were $6,140,000, liabilities were $1,950,000, and no additional common stock was issued or dividends paid.
In: Accounting
On January 1, 2018, the Mason Manufacturing Company began construction of a building to be used...
On January 1, 2018, the Mason Manufacturing Company began
construction of a building to be used as its office headquarters.
The building was completed on September 30, 2019.
Expenditures on the project were as follows:
| January 1, 2018 | $ | 2,020,000 | |
| March 1, 2018 | 1,740,000 | ||
| June 30, 2018 | 1,940,000 | ||
| October 1, 2018 | 1,740,000 | ||
| January 31, 2019 | 441,000 | ||
| April 30, 2019 | 774,000 | ||
| August 31, 2019 | 1,071,000 | ||
On January 1, 2018, the company obtained a $4,900,000 construction
loan with a 12% interest rate. The loan was outstanding all of 2018
and 2019. The company’s other interest-bearing debt included two
long-term notes of $2,000,000 and $8,000,000 with interest rates of
8% and 10%, respectively. Both notes were outstanding during all of
2018 and 2019. Interest is paid annually on all debt. The company’s
fiscal year-end is December 31.
In: Accounting
Causwell Company began 2018 with 22,000 units of inventory on hand. The cost of each unit...
Causwell Company began 2018 with 22,000 units of inventory on
hand. The cost of each unit was $6.00. During 2018 an additional
42,000 units were purchased at a single unit cost, and 32,000 units
remained on hand at the end of 2018 (32,000 units therefore were
sold during 2018). Causwell uses a periodic inventory system. Cost
of goods sold for 2018, applying the average cost method, is
$225,600. The company is interested in determining what cost of
goods sold would have been if the FIFO or LIFO methods were
used.
Required:
1. Determine the cost of goods sold for 2018 using
the FIFO method. [Hint: Determine the cost per unit of
2018 purchases.]
2. Determine the cost of goods sold for 2018 using
the LIFO method. (Do not round intermediate
calculations.)
|
In: Accounting
Grayson is in the 24 percent tax rate bracket and has sold the following stocks in...
Grayson is in the 24 percent tax rate bracket and has sold the
following stocks in 2018: (Loss amounts should be indicated
by a minus sign.)
| Description | Date Purchased | Basis | Date Sold | Amount Realized | ||
| Stock A | 1/23/1994 | $ | 8,000 | 7/22/2018 | $ | 5,100 |
| Stock B | 4/10/2018 | 15,500 | 9/13/2018 | 19,330 | ||
| Stock C | 8/23/2016 | 12,625 | 10/12/2018 | 17,850 | ||
| Stock D | 5/19/2008 | 5,830 | 10/12/2018 | 13,525 | ||
| Stock E | 8/20/2018 | 7,825 | 11/14/2018 | 3,875 | ||
a. What is Grayson’s net short-term capital gain
or loss from these transactions?
b. What is Grayson’s net long-term gain or loss
from these transactions?
c. What is Grayson’s overall net gain or loss from
these transactions?
In: Accounting
This information is available for Pharoah Company for 2017, 2018, and 2019. 2017 2018 2019 Beginning...
|
|
|||||||||||||||||||||||||
|
|||||||||||||||||||||||||||||||
|
In: Accounting
Item 13 Item 13 Neely BBQ leased equipment from Smoke Industries on January 1, 2018. Smoke...
Item 13 Item 13 Neely BBQ leased equipment from Smoke Industries on January 1, 2018. Smoke Industries had manufactured the equipment at a cost of $810,000. (FV of $1, PV of $1, FVA of $1, PVA of $1, FVAD of $1 and PVAD of $1) (Use appropriate factor(s) from the tables provided.) Other information: Lease term 4 years Annual payments $360,000 beginning Jan. 1, 2018, and at Dec. 31, 2018, 2019, and 2020 Life of asset 4 years Rate the lessor charges 8% Required: 1. Prepare the appropriate entries for Neely BBQ (Lessee) on January 1, 2018, and December 31, 2018. 2. Prepare the appropriate entries for Smoke Industries (Lessor) on January 1, 2018, and December 31, 2018. Assume that control is transferred to the lessee. 3. Prepare the appropriate entries for Smoke Industries (Lessor) on January 1, 2018, and December 31, 2018. Assume that control is not transferred to the lessee.
In: Accounting