Questions
Think about a DATABASE PROJECT (BUSINESS PROBLEM) you want to do after school show me the...
Think about a DATABASE PROJECT (BUSINESS PROBLEM) you want to do after school
show me the attributes
create a three table for it and explain each table and what it mean.
In: Computer Science
Under System requirement provide a detail overall description, product perspective, Memory Constraint, user interface, Site adaptation...
Under System requirement provide a detail overall description, product perspective, Memory Constraint, user interface, Site adaptation Requirements and Operations of building a HBCU Database Hub/Center.
In: Computer Science
Using the module discussion forum, work with your fellow students to identify any other database benefits...
Using the module discussion forum, work with your fellow students to identify any other database benefits you can think of, as say compared to a spreadsheet or basic file storage.
In: Computer Science
Project: Building a Relational Database Management System This project is where you show off your...
Project: Building a Relational Database Management System
This project is where you show off your ability to (1) translate a business requirement into a database design, (2) design a database using one-to-many and many-to-many relationships, and (3) know when to use LEFT and/or RIGHT JOINs to build result sets for reporting.
An organization grants key-card access to rooms based on groups that key-card holders belong to. You may assume that users below to only one group. Your job is to design the database that supports the key-card system.
There are six users, and four groups. Modesto and Ayine are in group “I.T.” Christopher and Cheong woo are in group “Sales”. There are four rooms: “101”, “102”, “Auditorium A”, and “Auditorium B”. Saulat is in group “Administration.” Group “Operations” currently doesn’t have any users assigned. I.T. should be able to access Rooms 101 and 102. Sales should be able to access Rooms 102 and Auditorium A. Administration does not have access to any rooms. Heidy is a new employee, who has not yet been assigned to any group.
After you determine the tables any relationships between the tables (One to many? Many to one? Many to many?), you should create the tables and populate them with the information indicated above.
Next, write SELECT statements that provide the following information:
• All groups, and the users in each group. A group should appear even if there are no users assigned to the group.
• All rooms, and the groups assigned to each room. The rooms should appear even if no groups have been assigned to them.
• A list of users, the groups that they belong to, and the rooms to which they are assigned. This should be sorted alphabetically by user, then by group, then by room.
In: Computer Science
HI.... just I want the <tags> of this scenario .... Scenario-based Problem: You are assigned to...
HI.... just I want the <tags> of this scenario ....
Scenario-based Problem:
You are assigned to develop a web based Online Electronic showroom
in the Sultanate of oman using HTML 5 with CSS, basic JavaScript
and PHP&MySQL. The website should contain the following
webpages:
-
Homepage
-
Sign In
-
Sign Up
-
About Us
-
Product Details
-
Feedback
-
Contact Us
Following are the details about each page:
Page-1: HOMEPAGE (Design using Bootstrap)
This page should have picture/s, background color, text/headings with suitable font with link to all other pages and CSS.
Page-2: ABOUT US
This page should have a brief description of the company. This should contain a paragraph with sufficient text color, formatting tags, images, links and CSS.
Page-3 and 4:Product DETAILS
Each page should contain Tables with column span and row span, CSS, images, formatting tags, etc. Include any video related to the topic.
Page-5: SIGN IN (No database)
This should contain the login form with validations using HTML5, PHP form handling, database connectivity.
Page-6: SIGN UP
This should contain the Registration form with validations using JavaScript, PHP form handling, database connectivity. Display the records from the table.
Page-7: FEEDBACK (No database)
This should contain the Feedback form with validations using HTML 5 and PHP form handling. Display the feedback.
Page-8: CONTACT US
This should contain a paragraph with sufficient text color, formatting tags, images, links, CSS etc. Note: Kindly refer to the marking scheme for more information and clarity.
In: Computer Science
You are purchasing a car from your grandparents. You agree topay them $2000 today and...
You are purchasing a car from your grandparents. You agree to pay them $2000 today and $2000 per year for the next 3 years. If the Kelly Blue Book value of the car is $7,200, what is the implied interest rate you are paying your grandparents?
In: Finance
The number of cell phone subscribers in the United States between the years 2000 and 2010...
The number of cell phone subscribers in the United States between the years 2000 and 2010 is approximated by the function N(t) = 385.474 1 + 2.521e−0.214t (0 ≤ t ≤ 10) where N(t) is measured in millions and t is measured in years, with t = 0 corresponding to the year 2000.† How many cell phone subscribers were there in the United States in 2000? (Round your answer to one decimal place.) million subscribers.
If the trend continued, how many subscribers were there in 2011? (Round your answer to one decimal place.) million subscribers
In: Math
The monthly absolute estimate of global (land and ocean combined) temperature indexes (degrees C ) in...
The monthly absolute estimate of global (land and ocean combined) temperature indexes (degrees C ) in 2000 and 2001 are: 2000: 12.28, 12.63, 13.22, 14.21, 15.13, 15.82, 16.05, 16.02, 15.29, 14.29, 13.16, 12.47
2001: 22.44, 12.55, 13.35, 14.22, 15.28, 15.99, 16.23, 16.17, 15.44, 14.52, 13.52, 12.61
a) Graph the data and fit a regression line to predict 2001 temperatures from those in 2000. Is there a significant regression at ∝ = 0.05? What is P-value?
b) Estimate the correlation coefficient.
Please solve question without using software
In: Statistics and Probability
The following table shows the average retail price of butter and the Consumer Price Index from 1980 to 2010
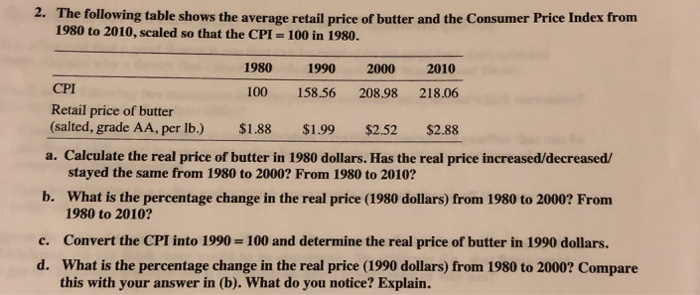
The following table shows the average retail price of butter and the Consumer Price Index from 1980 to 2010, scaled so that the CPI 100 in 1980.
| 1980 | 1990 | 2000 | 2010 | |
|---|---|---|---|---|
| CPI | 100 | 158.56 | 208.98 | 218.06 |
| Retail price of butter (salted, grade AA, per lb.) | ||||
| $1.88 | $1.99 | $2.52 | $2.88 |
a. Calculate the real price of butter in 1980 dollars. Has the real price increased/decreased/ stayed the same from 1980 to 2000? From 1980 to 2010?
b. What is the percentage change in the real price (1980 dollars) from 1980 to 2000? From 1980 to 2010?
c. Convert the CPI into 1990- 100 and determine the real price of butter in 1990 dollars.
d. What is the percentage change in the real price (1990 dollars) from 1980 to 2000? Compare this with your answer in (b). What do you notice? Explain.
In: Economics
For each counties in the metro area, it gives an estimate of the population on Jan....
For each counties in the metro area, it gives an estimate of the population on Jan. 1, 2000, and the percent change between 1/1/2000 and 1/1/2010. If we assume that the percent change for each county is constant, then the population of each county can be modeled using an exponential function with a growth rate given by the annual percentage change.
|
County |
2000 Population Estimate |
Annual Percent Change (Growth Rate) |
|
Cherokee |
141,925 |
4.2% dP/dt=0.042P |
|
Fayette |
91,263 |
1.6% dP/dt=0.016P |
- Find an exponential function of the form P(t)=P0ekt , which gives the population of the county in the year 2000 + t.
- Evaluate the function at t = 16 and give a verbal interpretation of your answer.
- Find the derivative of the function.
- Evaluate the derivative at t = 16 and give a verbal interpretation of your answer.
In: Advanced Math