Questions
In 2004, Google launched its IPO via Dutch Auction. Different from traditional IPO processes(Firm commitment and...
In 2004, Google launched its IPO via Dutch Auction. Different from traditional IPO processes(Firm commitment and Best efforts), Dutch Auction allows every investor, including small investors, to submit her bids online for IPO shares. It does not involve the “road show” or book building from investment banks.
Google’s IPO price was $85, and it opened at $100 at the first day of trading, reflecting a 17.6 percent underpricing. 83 percent of the IPOs issued between January and November 2004 experienced less underpricing than Google did. In your opinion, if Google had adopted a traditional IPO process, would Google have been able to set up a higher IPO price? Please explain.
In: Finance
In 2004, Google launched its IPO via Dutch Auction. Different from traditional IPO process we described...
In 2004, Google launched its IPO via Dutch Auction. Different from traditional IPO process we described in handout 2, Dutch Auction allows every investor, including small investors, to submit her bids online for IPO shares. It does not involve the “road show” or book building from investment banks.
Google’s IPO price was $85, and it opened at $100 at the first day of trading, reflecting a 17.6 percent underpricing. 83 percent of the IPOs issued between January and November 2004 experienced less underpricing than Google did. In your opinion, if Google had adopted a traditional IPO process, would Google have been able to set up a higher IPO price? Please explain.
In: Finance
The balance sheets at the end of each of the first two years of operations indicate...
The balance sheets at the end of each of the first two years of
operations indicate the following:
| 2017 | 2016 | ||
| Total current assets | $600,000 | $560,000 | |
| Total investments | 60,000 | 40,000 | |
| Total property, plant, and equipment | 900,000 | 700,000 | |
| Total current liabilities | 125,000 | 80,000 | |
| Total long-term liabilities | 350,000 | 250,000 | |
| Preferred 9% stock, $100 par | 100,000 | 100,000 | |
| Common stock, $10 par | 600,000 | 600,000 | |
| Paid-in capital in excess of par--common stock | 60,000 | 60,000 | |
| Retained earnings | 325,000 | 210,000 |
Based on the above information, if net income is $130,000 and
interest expense is $40,000 for 2017, and the market price is $40,
what is the price-earnings ratio on common stock (round to one
decimal place)?
In: Accounting
One of the first decisions you have to make as the brand manager for Verona coffee...
One of the first decisions you have to make as the brand manager for Verona coffee is whether or not to add a new line of coffee makers called the "Super-Verona" line. The line would be marketed in addition to the original Verona line. Your brand assistant has provided you with the following facts:
- The manufacturer sells to the wholesaler. The wholesaler sells to the jobber who, in turn, sells to the retailer.
- You are a part of the company that manufactures Verona. Hence, you have to view this problem from the perspective of the manufacturer of the product(and not from the middlemen).
a. Retail Selling Price.........................................................................................................$100/unit
b. Retailer's Margin..............................................................................................................32%
c. Jobber's Margin.................................................................................................................25%
d. Wholesaler's Margin..........................................................................................................20%
e. Direct Factory Labor...........................................................................................................$3/unit
f. Raw Materials......................................................................................................................$6/unit
g. Additional Factory and Admin Overheads...........................................................................$4/unit
h. Salesperson's Commision ..................................................................................................10%(of manufacturer's selling price)
i. Incremental Sales Force Travel Cost....................................................................................$95,000
j. Advertising.............................................................................................................................$750,000
k. New Equipment Needed........................................................................................................$120,000(to be depreciated over 10 years)
l. Research and Development Spent up to now.........................................................................$250,000
m. Research and Development to be spent this year to commercialize the product.................. $625,000(to be ammortized over 5 years)
Questions:
1. What is the contribution per unit of the Super-Verona brand?
2. What is the break-even volume in units and in dollars?
3. What is the sales volume in units necessary for Super Verona to yield in the first year, a 16% return on the equipment to be invested in the project?
4. The $100 selling price for Super Verona seems high to you. You thought you might lower the price to $88/unit and raise retail margin to 36%. What is the new break-even volume in units?
In: Finance
What should you do if you come across a 2-year option pair with a strike price...
What should you do if you come across a 2-year option pair with a strike price of $100, a spot price of $100, a call premium of $22, a put premium of $15, and the risk-free rate is 5%?
In: Finance
Suppose the price level decreases from 150 to 100. Shift the appropriate curve on the graph to show the impact of a decrease in the overall price level


3. The theory of liquidity preference and the downward-sloping aggregate demand curve
The following graph shows the money market in a hypothetical economy. The central bank in this economy is called the Fed Assume that the Fed fixes the quantity of money supplied. Suppose the price level decreases from 150 to 100. Shift the appropriate curve on the graph to show the impact of a decrease in the overall price level.
Tool tip: Click and drag the appropriate curve. Curves will snap into position, so if you try to move the curve and it snaps back to its original position, just try again and drag it a little farther.
The lower price level shifts the money quantity of money demanded at the initial interest rate of 3% will be Fed. People will try to interest-bearing assets, and bond issuers will find that they reaches its new equilibrium at an interest rate of curve to the . After the decrease in the price level, the than the quantity of money supplied by the their money holdings. In order to do so, people will bonds and other interest rates until the money market
The change in the interest rate that you found previously will cause residential and business investment spending to leading to in the quantity of output demanded in the economy. The following graph shows the economy's aggregate demand curve. Show the impact of the decrease in the price level by moving the point along the curve or shifting the curve.
Tool tip: Click and drag either the curve or the dot, whichever applies. Either element will snap into position, so if you try to move it and it snaps back to its original position, just try again and drag it a little farther.
In: Economics
The following table shows the average retail price of butter and the Consumer Price Index from 1980 to 2010
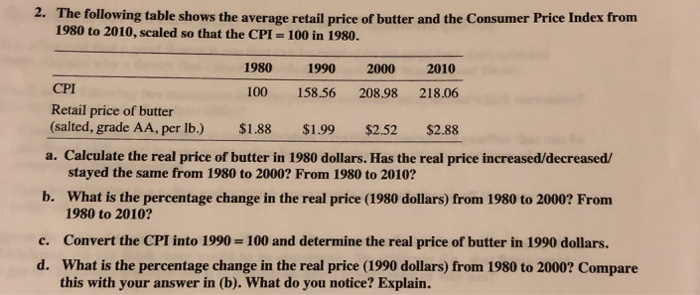
The following table shows the average retail price of butter and the Consumer Price Index from 1980 to 2010, scaled so that the CPI 100 in 1980.
| 1980 | 1990 | 2000 | 2010 | |
|---|---|---|---|---|
| CPI | 100 | 158.56 | 208.98 | 218.06 |
| Retail price of butter (salted, grade AA, per lb.) | ||||
| $1.88 | $1.99 | $2.52 | $2.88 |
a. Calculate the real price of butter in 1980 dollars. Has the real price increased/decreased/ stayed the same from 1980 to 2000? From 1980 to 2010?
b. What is the percentage change in the real price (1980 dollars) from 1980 to 2000? From 1980 to 2010?
c. Convert the CPI into 1990- 100 and determine the real price of butter in 1990 dollars.
d. What is the percentage change in the real price (1990 dollars) from 1980 to 2000? Compare this with your answer in (b). What do you notice? Explain.
In: Economics
The following graph contains four lines (A, B, C and D), each of which has a...
The following graph contains four lines (A, B, C and D), each of which has a slope that is either positive, negative, zero, or infinite.

For each of the following scenarios, indicate whether the relationship between the two variables is positive or negative, as well as which line on the previous graph has a slope that reflects this type of relationship.
Hint: The X-axis and Y-axis on the graph are not labeled intentionally. You need to substitute the variables from each scenario for the horizontal and vertical axis. For example, in the first scenario, X-axis should be labeled The average grade received" and Y-axis should be labeled "The number of hours spent studying".
As the number of hours spent watching TV rises, the average grade received falls.
As the number of hours spent studying falls, the likelihood of getting an A falls.
As the number of hours spent studying rises, the average grade received rises.
True or False: Line A has a slope of infinity.
True
False
The following graphs show the relationship between the price of apples and the quantity of apples supplied in two different regions, the North and the and South. Assume that the two lines are parallel.

In the North, if the price goes up by $0.20 per pound, then the quantity supplied in the North goes up by 100 pounds per year. If the price of apples goes up by $0.20 in the South, what will happen to the quantity supplied?
The quantity will increase by 50 pounds per year.
There is not enough information given to determine the supply change in the South.
The quantity will decrease by 100 pounds per year.
The quantity will increase by 100 pounds per year.
In: Economics
Jamie and Cecilia Reyes are husband and wife and file a joint return. They live at...
In: Accounting
In October of 2016, Jack and Judy, husband and wife, sold their (only) residence that they...
In October of 2016, Jack and Judy, husband and wife, sold their (only) residence that they had purchased in 1999 for $400,000 paying $300,000 in cash with a $100,000 mortgage from ABC Bank. They lived there the entire time they owned the home, and they made repairs to the electric and plumbing during their 10-year ownership totaling $40,000. What, if any, is their recognized gain or loss to be included on their jointly filed Form 1040 for 2017?
a. $400,000.
b. $0.
c. $500,000.
d. $440,000.
e. None of the above.
My answer is (b) 0. Under the MFJ rules for sale of home they are able to exclude up to a 500,000 gain or loss before any amount is recognized. Am I correct and if not could you show me how you derived at your answer? Thanks!
In: Accounting