Questions
Calculate the magnitude and direction of both the equilibrant and the resultant of the following three...
Calculate the magnitude and direction of both the equilibrant and the resultant of the following three vectors: 0.4N at 60°, 0.5N at 30°, and 0.2N at 330° .The object of this experiment is to demonstrate the vector property of forces and to gain experience in the addition of vector quantities.
In: Physics
what was the purpose/hypotheses, basic method, findings, limitations/criticisms, issues, and how can we use the information...
what was the purpose/hypotheses, basic method, findings, limitations/criticisms, issues, and how can we use the information today from the Bobo Doll experiment? What topic in social psychology did it help define?
In: Psychology
Albert Bandura's Bobo Doll experiment changed the way we think about modeling and social learning. In...
Albert Bandura's Bobo Doll experiment changed the way we think about modeling and social learning. In your opinion, do you think that children learn violent behavior from playing video games?
In: Psychology
Define the term “Historical Control” and explain its relevance to issues surrounding the differences between a...
Define the term “Historical Control” and explain its relevance to issues surrounding the differences between a “Randomized Controlled Experiment” and an “Observational Study”.
Explain the difference between a “quantitative variable” and a “qualitative variable” and give an example of each.
In: Math
Question 1 (20 Marks) Each of the following independent cases describes a situation with a proposed...
Question 1
Each of the following independent cases describes a situation with a proposed tax treatment. For each case indicate whether the treatment is correct, justify your conclusion.
Case A: In 1980, Brenda Carter bought a 400-acre parcel of land for $ 300,000. She was going to build a home on the property. However, in 2017, she received an offer of $ 800,000 for 150 acres of the property. Because these 150 acres of land were waterfront and had better road access, she thought the fair market value of the remaining 250 acres was only $ 200,000. She accepted the $ 800,000 offer. In filing her 2017 income tax return, she was going to use an adjusted cost base of $ 240,000{[$ 300,000 X [$ 800,000/($ 800,000 + $ 200,000)} in calculating her gain.
Case B: Cody Dexter sold a property with an adjusted cost base of $ 25,000 for $ 75,000. He provided a warranty on the property that he estimates would cost him about $ 10,000 to service. As a result, he calculated his capital gain to be $ 40,000.
Case C: Rosie Tell sold a sofa to her daughter for $ 1,500 and a painting to her son for $ 800. These selling prices equaled their estimated fair market value. Several years ago, Rosie Tell purchased the sofa for $ 1,600 and the painting for $ 500. She did not report any capital gain or loss on her individual income tax return.
Case D: Nathan Marks purchased a cottage in 2011 for $ 250,000. He rarely used the cottage, as he preferred to live in his Victoria condo. The cottage’s current value is $ 600,000 in 2017. In 2017, he decided to convert the cottage into a rental property. Nathan has told everyone that, in 2017, he will report all of his rental income, but he does not intend to recognize a gain or loss on the conversion of the property, since no disposition has occurred.
Case E: In 2017, Ida Forest sold a non-depreciable capital asset for $ 320,000. The adjusted cost base of the asset was $ 200,000, resulting in a capital gain of $ 120,000. Under the terms of the sale, she received $ 32,000 (10% of the proceeds) in 2017, with the remainder being paid in 2018.Thus, she is going to report $ 12,000 capital gains on her 2017 income tax return [10% X $ 120,000].
Question 2
Elizabeth Font owned 200,000 shares of ABC Ltd., a publicly traded Canadian corporation. These shares, including brokerage fees, were acquired at a cost of $ 400,000. Based on current trading values, these shares are now worth $ 950,000.
The following four cases make different assumptions as to the identity of the purchaser, the circumstances of the sale, and the proceeds of disposition. In each case, assume that the purchaser immediately resold the shares for their fair market value of $ 950,000.
Case 1: Because Elizabeth needed funds to acquire a house for her mother, she sold the shares to an arm’s length party for $ 950,000.
Case 2: Elizabeth gifted the shares to her 16 year old son..
Case 3: Elizabeth sold the shares to her sister for $ 100,000 to create a loss, as Elizabeth had realized significant capital gains during the current year. Since her sister had no other source of income, Elizabeth’s sister would be taxed on the gain from the resale at the minimum federal rate.
Case 4: Elizabeth’s father had realized a large amount of capital gains during the current year. To help her father, Elizabeth sold the shares to him for $ 1,000,000. Elizabeth’s father planned to use the loss on the immediate resale to offset his capital gains.
Required:
For each of the cases, advise Elizabeth of the tax consequences that will result from the disposition and indicate the tax consequences to the purchaser of the shares when they are resold. In addition, in cases 3 and 4, indicate whether the stated tax planning objective was achieved.
Question 3
Mr. William Worth was an accountant. During 2016, he had net income for tax purposes and taxable income of $ 100,000, all of which was employment income.
The following five independent cases made assumptions with respect to Mr. William Worth’s marital status and his number of dependants. In addition, the five cases provided other information that was relevant to the determination of Mr. William Worth’s 2016 tax payable. In all cases, his employer withheld the required EI premiums and CPP contributions.
Case A: Mr. William Worth was married to Sonya Worth. Mrs. Sonya Worth’s 2016 net income for tax purposes was $ 7,000. Their 20 year old son, Angus, attended university on a full time basis, for 11 months in 2016. Mr. William Worth paid all of his son’s university costs, which included $ 8,800 for tuition and $ 1,600 for textbooks. Angus worked part time in 2016 and had net income for tax purposes of $6,000. Angus agreed to transfer any unused education related credits to his father.
Case B: Mr. William Worth was never married. However, he obtained custody of his 8 year old daughter, Connie, when Connie’s mother died. During2016, Mr. William Worth received universal child care benefits of $ 360. He elected to include the $ 360 amount in Connie’s 2016 net income for tax purposes, since Connie had no other income. Although he graduated from university several years ago, Mr. William Worth still had an outstanding $ 50,000 Canada student loan. During2016, Mr. William Worth paid $ 2,000 interest on this loan
Case C: Mr. William Worth was married to Sonya Worth. Mrs. Sonya Worth’s 2016 net income for tax purposes was $ 4,000. Mr. William Worth’s 90 year old father, Walter, and Sonya’s 60 year old mother, Sandra, lived with William and Sonya. Walter had 2016 net income for tax purposes of $ 17,000, while Sandra had 2016 net income for tax purposes of $ 7,000. Both Walter and Sandra were very healthy.
Case D: Mr. William Worth was married to Sonya Worth. Mrs. Sonya Worth’s 2016 net income for tax purposes was $ 6,000. William and Sonya had two children, Betty who was 10 years old and Bobby who was 8 years old. Neither child had any income during 2016. The family’s eligible medical expenses were as follows:
William1,400Sonya1,100Betty2,600Bobby3,700Total8,800
Case E: Mr. William Worth was never married. During 2016, he won $ 200,000 in the provincial lottery. Mr. William Worth donated the entire $ 200,000 to the United Way, a registered Canadian charity. On his 2016 income tax return, he only claimed $ 30,000 of his total donation. Since he made donations in previous years, he was not eligible, in 2016, for the first-time donor’s super credit. Mr. William Worth also contributed $ 1,500 to a federal political party in 2016.
Required:
In each case, calculate Mr. William Worth’ minimum federal income tax payable for 2016. Indicate any carry forwards available to him and to his dependants and the carry forward provisions. Ignore any tax amounts that Mr. William Worth might have had withheld or paid in instalments
Question 4
Mr. Tom Talent was 50 years old and lived in Vancouver, British Columbia. He worked in the accounting department of a large retail store.
Mr. Tom Talent’s Personal Information
Mr. Tom Talent was divorced and had custody of his 8 year old son, Andrew. In 2016, Andrew had net income for tax purposes of $ 6,500. The $ 6,500 was comprised 100% of interest income, which was earned on bonds acquired from an inheritance. Andrew’s medical condition qualified Andrew for the disability tax credit. Tom elected to include the $ 360 amount in Andrew’s 2016 net income for tax purposes.
In 2016, Mr. Tom Talent installed access ramps in his home, to assist Andrew in getting around. The access ramps cost $ 13,000.
Mr. Tom Talent, during 2016, volunteered 250 hours as a north shore search and rescue volunteer. He received $ 300 in compensation for this work.
Mr. Tom Talent’s 78 year old father, Dennis, lived with Tom. Dennis provided care for Andrew on a full time basis. In 2016, Dennis had $ 14,000 net income for tax purposes.
In 2016, Mr. Tom Talent bought public transit passes for himself and his father. Tom bought 12 monthly passes for himself at a monthly rate of $ 90; and, he bought 12 monthly passes for his father at a monthly senior rate of $ 50.
Mr. Tom Talent incurred the following medical expenses in 2016:
Prescription Drugs For Andrew3,000Various Medical Treatments For Andrew10,000Plastic Surgery For Tom4,500Dentist Fees For Dennis3,500Dentures For Dennis4,000Total Medical Expenses25,000
Mr. Tom Talent, during 2016, donated $ 4,000 to the United Way, a registered Canadian charity. Since that was the first time that he ever made a donation, Tom was eligible for the first time donor’s super credit.
Employment Information
In 2016, Mr. Tom Talent’s salary compensation was $ 120,000. $ 12,000 federal income tax was withheld. Furthermore, he was awarded a year-end bonus of $ 15,000, payable in 2017
Mr. Tom Talent’s employer withheld maximum CPP and EI amounts. As well, Mr. Tom Talent and his employer each contributed $ 4,000 to a defined benefit registered pension plan.
Mr. Tom Talent’s employer offered to pay the tuition for employees taking language courses. Consequently, in 2016, Tom enrolled in a French class. Tom’s employer paid the $ 4,000 tuition fees for Tom’s French course. The $ 4,000 amount was included in Tom’s employment income as a taxable benefit, which was in addition to the $ 120,000 salary that Tom received. The French course was for 10 months and the French course included 10 hours of classes per week. Tom personally paid $ 300 for his own textbooks.
Mr. Tom Talent was provided with disability insurance by an employer sponsored plan. Commencing in 2012, Tom contributed $ 400 per year to the plan’s coverage and his employer made matching contributions each year. As a result of an accident in 2016, Tom was unable to work for 2 months, thus, he received $ 7,000 under this plan
Mr. Tom Talent’s employer provided Tom with an automobile. The automobile was acquired by the company several years ago at a total cost of $ 25,000. During 2016, the automobile was driven 40,000 kilometres, 35,000 of which were for employment related travel. Excluding the 2 months when Tom was off work due to the accident, the automobile was available to Tom throughout 2016. During the two months when Tom was off work, the automobile was left at his employer’s parking lot. Tom was required to pay his own operating costs, which was $ 7,000 in 2016.
Mr. Tom Talent’s employer provided all of its employees with financial counseling services. Tom’s cost to the employer was $ 600.
Mr. Tom Talent finished the quarterly reports under budgeted time, so Tom’s employer gave him a $ 6,000 performance award.
On June 15, 2015, Mr. Tom Talent received options to acquire 300 of his employer’s stock [a public company] at a price of $ 25 per share. At that time, the shares were trading at $ 25 per share. Tom exercised these options on September 15, 2016, when the shares were trading at $ 30 per share. Tom was still holding these shares at December 31, 2016, as Tom did not plan on selling the shares for several years.
Required:
Calculate Mr. Tom Talent’s 2016 minimum taxable income and federal tax payable. Ignore GST and PST considerations.
In: Accounting
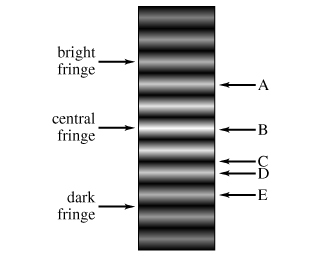
The figure (Intro 1 figure) shows the interference pattern obtainedin a double-slit experiment with light...
The figure (Intro 1 figure) shows the interference pattern obtained in a double-slit experiment with light of wavelength λ.

Part A
Identify the fringe or fringes that result from the interference of two waves whose phases differ by exactly 2λ.
Enter the letter(s) indicating the fringe(s) in alphabetical order. For example, if you think that fringes A and C are both correct, enter AC.
Part B
The same double-slit experiment is then immersed in water (with an index of refraction of 1.33) and repeated. When in the water, what happens to the interference fringes?
|
In: Physics
A double-slit experiment yields an interference pattern due to the path length difference from light traveling...
A double-slit experiment yields an interference pattern due to the path length difference from light traveling through one slit versus the other. Why does a single slit show a diffraction pattern?
A double-slit experiment yields an interference pattern due to the path length difference from light traveling through one slit versus the other. Why does a single slit show a diffraction pattern?
| The single slit must have something in the middle of it, causing it to act like a double slit. | |
| There is a path length difference from waves originating at different parts of the slit. | |
| The wavelength of the light is shorter than the slit. | |
| The light passing through the slit interferes with light that does not pass through. |
In: Physics
The experiment of rolling a fair six-sided die twice and looking at the values of the...
The experiment of rolling a fair six-sided die twice and looking at the values of the faces that are facing up, has the following sample space.
For example, the result (1,2) implies that the face that is up from the first die shows the value 1 and the value of the face that is up from the second die is 2.
sample space of tossing 2 die
A pair of dice is thrown.
Let X = the number of multiples of 2.
Complete the table to construct a probability distribution for X using the sample space from the experiment of rolling two fair six-sided dice.
Note: Your answers should be approximate decimals to 4 places.
|
X |
P(x) |
|
0 |
|
|
1 |
|
|
2 |
Probability distribution for X = num. of multiples of
2
In: Statistics and Probability
How many moles of ethane were burnt
240 cm3 of ethane (C2H6) was burnt in a controlled way and found to raise the temperature of 100 cm3 of water by 33.5 °C. (specific heat capacity of water = 4.18Jg–1K–1; 1mol of gas molecules occupies 24.0 dm3 at r.t.p.)
a. How many moles of ethane were burnt?
b. Calculate the heat change for the experiment.
c. Calculate the molar enthalpy change of combustion for ethane, as measured by this experiment.
d. Use the values below to calculate the standard molar enthalpy change for the complete combustion of ethane.
ΔHQf[CO2] = –394 kJ mol–1
ΔHQf[H2O] = –286 kJ mol–1
ΔHQf[C2H6] = –85 kJ mol–1
e. Give possible reasons for the discrepancy between the two results.
In: Chemistry
Question: Write the reaction(s), with the reactant and products' structures to describe the following experiment. In...
Question: Write the reaction(s), with the reactant and products' structures to describe the following experiment.
In this experiment you will steam distill clove oil from freshly ground cloves. Following the distillation, clove oil and water will be present in the receiving flask. Because clove oil will be a minor fraction of the distillate, the clove oil must be extracted from the water into an organic solvent such as dichloromethane. Removing the dicholormethane layer leaves clove oil as the product.
The steps to be taken are:
1. Place ground cloves of garlic and water in a distilling flask
2. Distill the mixture (steam distillation)
3. Extract the clove oil into the dicholormethane and dry this with anhydrous NA2SO4
4. Remove the dichloromethane from the clove oil by distillation and finally weight the clove oil
In: Chemistry