Questions
Socola and Brooke are balanced on a teeter-totter plank as shown below. Socola has a mass...
Socola and Brooke are balanced on a teeter-totter plank as shown below. Socola has a mass of 7.7 kg, and Brooke’s mass is 53 kg. Brooke is located 1.0 m from the pivot. Assume the plank is massless, and calculate how far Socola is from the pivot (x).
In: Physics
We observe three well-diversified portfolios A, B and C with a return of 15%, 6%, and...
We observe three well-diversified portfolios A, B and C with a return of 15%, 6%, and 12% respectively in the market. We also know that portfolio A, B and C has a beta of 1.5, 0.5, and 1.0 respectively. Construct an arbitrage strategy, and how much is the arbitrage profit?
In: Finance
A 20KVA , 2400/240 single-phase transformer has Reqp=4.45 ohm and Xeq1=6.45 ohm, Plot the voltage regulation...
A 20KVA , 2400/240 single-phase transformer has
Reqp=4.45 ohm and
Xeq1=6.45 ohm, Plot the voltage regulation as load current
increased
from no-load to full-load at different power factor 0.85 lagging,
1.0 and
0.85 leading using Matlab.
In: Electrical Engineering
At 650 K, the reaction MgCO3(s)?MgO(s)+CO2(g) has Kp=0.026. A 12.5L container at 650 K has 1.0...
At 650 K, the reaction MgCO3(s)?MgO(s)+CO2(g) has Kp=0.026. A 12.5L container at 650 K has 1.0 g of MgO(s) and CO2 at P = 0.0260 atm. The container is then compressed to a volume of 0.500L . Find the Mass of MgCO3 that is formed
In: Chemistry
An ideal monatomic gas at an initial temperature of 500 K is expanded from 5.0 atm...
An ideal monatomic gas at an initial temperature of 500 K is expanded from 5.0 atm to a final pressure of 1.0 atm. Calculate w, q, DU, and (where applicable) DH and DT when the expansion is performed (a) reversibly and isothermally, and (b) reversibly and adiabatically.
Help Please!!!
In: Chemistry
This is a work integrated assessment item. The tasks are similar to what would be carried...
This is a work integrated assessment item. The tasks are similar to what would be carried out in the workplace.
Tully Tyres sells cheap imported tyres. The manager believes its profits are in decline. You have just been hired as an analyst by the manager of Tully Tyres to investigate the expected profit over the next 12 months based on current data.
•Monthly demand varies from 100 to 200 tyres – probabilities
shown in the partial section of the spreadsheet below, but you have
to insert formulas to ge the cumulative probability distribution
which can be used in Excel with the VLOOKUP command.
•The average selling price per tyre follows a discrete uniform
distribution ranging from $160 to $180 each. This means that it can
take on equally likely integer values between $160 and $180 – more
on this below.
•The average profit margin per tyre after covering variable costs
follows a continuous uniform distribution between 20% and 30% of
the selling price.
•Fixed costs per month are $2000.
(a)Using Excel set up a model to simulate the next 12 months to determine the expected average monthly profit for the year. You need to have loaded the Analysis Toolpak Add-In to your version of Excel. You must keep the data separate from the model. The model should show only formulas, no numbers whatsoever except for the month number.
You can use this partial template to guide you:
| Ajax Tyres | |||||||
| DATA | |||||||
| Prob | Cummilaty prob | Demand | Selling | Price | $160 | $180 | |
| 0.05 | 100 | Monthly | Fixed cost | $2,000 | |||
| 0.1 | 120 | Profit | Margin | 20% | 30% | ||
| 0.2 | 140 | ||||||
| 0.3 | 160 | ||||||
| 0.25 | 180 | ||||||
| 0.1 | 200 | ||||||
| 1 | |||||||
| MODEL | |||||||
| Selling | Profit | Fixed | |||||
| Month | RN1 | Demand | Price | RN2 | Margin | Costs | Profit |
| 1 | 0.23297 | #N/A | $180 | 0.227625 | 0.2 |
The first random number (RN 1) is to simulate monthly demands
for tyres.
•The average selling price follows a discrete uniform distribution
and can be determined by the function =RANDBETWEEN(160,180) in this
case. But of course you will not enter (160,180) but the data cell
references where they are recorded.
•The second random number (RN 2) is used to help simulate the
profit margin.
•The average profit margin follows a continuous uniform
distribution ranging between 20% and 30% and can be determined by
the formula =0.2+(0.3-0.2)*the second random number (RN 2). Again
you do not enter 0.2 and 0.3 but the data cell references where
they are located. Note that if the random number is high, say 1,
then 0.3-0.2 becomes 1 and when added to 0.2 it becomes 0.3. If the
random number is low, say 0, then 0.3-0.2 becomes zero and the
profit margin becomes 0.2.
•Add the 12 monthly profit figures and then find the average
monthly profit.
Show the data and the model in two printouts: (1) the results, and (2) the formulas. Both printouts must show the grid (ie., row and column numbers) and be copied from Excel and pasted into Word. See Spreadsheet Advice in Interact Resources for guidance.
(b)Provide the average monthly profit to Ajax Tyres over the 12-month period.
(c)You present your findings to the manager of Ajax Tyres. He thinks that with market forces he can increase the average selling price by $40 (ie from $200 to $220) without losing sales. However he does suggest that the profit margin would then increase from 22% to 32%.
He has suggested that you examine the effect of these changes and report the results to him. Change the data accordingly in your model to make the changes and paste the output in your Word answer then write a report to the manager explaining your conclusions with respect to his suggestions. Also mention any reservations you might have about the change in selling prices.
The report must be dated, addressed to the Manager and signed
off by you.
In: Statistics and Probability
1. In a certain school district, it was observed that 30% of the students in the...
1.
In a certain school district, it was observed that 30% of the
students in the element schools were classified as only children
(no siblings). However, in the special program for talented and
gifted children, 136 out of 392 students are only children. The
school district administrators want to know if the proportion of
only children in the special program is significantly different
from the proportion for the school district. Test at the α=0.02
level of significance.
What is the hypothesized population proportion for this test?
p=
(Report answer as a decimal accurate to 2 decimal places. Do
not report using the percent symbol.)
Based on the statement of this problem, how many tails would this
hypothesis test have?
- one-tailed test
- two-tailed test
Choose the correct pair of hypotheses for this situation:
| (A) | (B) | (C) |
|---|---|---|
| H0:p=0.3 |
Ha:p<0.3
| H0:p=0.3 |
Ha:p≠0.3
| H0:p=0.3 |
Ha:p>0.3
| (D) | (E) | (F) |
|---|---|---|
| H0:p=0.347 | ||
Ha:p<0.347
| H0:p=0.347 |
Ha:p≠0.347
| H0:p=0.347 |
Ha:p>0.347
(A)
(B)
(C)
(D)
(E)
(F)
Using the normal approximation for the binomial distribution
(without the continuity correction), what is the test statistic for
this sample based on the sample proportion?
z=
(Report answer as a decimal accurate to 3 decimal
places.)
You are now ready to calculate the P-value for this sample.
P-value =
(Report answer as a decimal accurate to 4 decimal
places.)
This P-value (and test statistic) leads to a decision to...
- reject the null
- accept the null
- fail to reject the null
- reject the alternative
As such, the final conclusion is that...
- There is sufficient evidence to warrant rejection of the assertion that there is a different proportion of only children in the G&T program.
- There is not sufficient evidence to warrant rejection of the assertion that there is a different proportion of only children in the G&T program.
- The sample data support the assertion that there is a different proportion of only children in the G&T program.
- There is not sufficient sample evidence to support the assertion that there is a different proportion of only children in the G&T program.
2.
In a certain school district, it was observed that 29% of the
students in the element schools were classified as only children
(no siblings). However, in the special program for talented and
gifted children, 122 out of 374 students are only children. The
school district administrators want to know if the proportion of
only children in the special program is significantly different
from the proportion for the school district. Test at the α=0.01
level of significance.
What is the hypothesized population proportion for this test?
p=
(Report answer as a decimal accurate to 2 decimal places. Do
not report using the percent symbol.)
Based on the statement of this problem, how many tails would this
hypothesis test have?
- one-tailed test
- two-tailed test
Choose the correct pair of hypotheses for this situation:
| (A) | (B) | (C) | H0:p=0.29 |
|---|
Ha:p<0.29
| H0:p=0.29 |
Ha:p≠0.29
| H0:p=0.29 |
Ha:p>0.29
| (D) | (E) | (F) | H0:p=0.326 | ||||
|---|---|---|---|---|---|---|---|
Ha:p<0.326
| H0:p=0.326 |
Ha:p≠0.326
| H0:p=0.326 |
Ha:p>0.326
(A)
(B)
(C)
(D)
(E)
(F)
Using the normal approximation for the binomial distribution
(without the continuity correction), was is the test statistic for
this sample based on the sample proportion?
z=
(Report answer as a decimal accurate to 3 decimal
places.)
You are now ready to calculate the P-value for this sample.
P-value =
(Report answer as a decimal accurate to 4 decimal
places.)
This P-value (and test statistic) leads to a decision to...
- reject the null
- accept the null
- fail to reject the null
- reject the alternative
As such, the final conclusion is that...
- There is sufficient evidence to warrant rejection of the assertion that there is a different proportion of only children in the G&T program.
- There is not sufficient evidence to warrant rejection of the assertion that there is a different proportion of only children in the G&T program.
- The sample data support the assertion that there is a different proportion of only children in the G&T program.
- There is not sufficient sample evidence to support the assertion that there is a different proportion of only children in the G&T program.
In: Statistics and Probability
Monte Carlo Simulation Tully Tyres sells cheap imported tyres. The manager believes its profits are in...
Monte Carlo Simulation
Tully Tyres sells cheap imported tyres. The manager believes its profits are in decline. You have just been hired as an analyst by the manager of Tully Tyres to investigate the expected profit over the next 12 months based on current data.
•Monthly demand varies from 100 to 200 tyres – probabilities
shown in the partial section of the spreadsheet below, but you have
to insert formulas to ge the cumulative probability distribution
which can be used in Excel with the VLOOKUP command.
•The average selling price per tyre follows a discrete uniform
distribution ranging from $160 to $180 each. This means that it can
take on equally likely integer values between $160 and $180 – more
on this below.
•The average profit margin per tyre after covering variable costs
follows a continuous uniform distribution between 20% and 30% of
the selling price.
•Fixed costs per month are $2000.
(a)Using Excel set up a model to simulate the next 12 months to determine the expected average monthly profit for the year. You need to have loaded the Analysis Toolpak Add-In to your version of Excel. You must keep the data separate from the model. The model should show only formulas, no numbers whatsoever except for the month number.
You can use this partial template to guide you:
| Tully Tyres | |||||||
| Data | |||||||
| Probability | Cumulative probability | Demand | Selling price | $160 | $180 | ||
| 0.05 | 100 | Monthly fixed cost | $2000 | ||||
| 0.1 | 120 | Profit margin | 20% | 30% | |||
| 0.2 | 140 | ||||||
| 0.3 | 160 | ||||||
| 0.25 | 180 | ||||||
| 0.1 | 200 | ||||||
| 1 | |||||||
| Model | |||||||
| Month | Random number1 | Demand | Selling price | Random number 2 | Profit margin | Fixed cost | Profit |
| 1 | 0.23297 | #N/A | $180 | 0.227625 | 0.2 | ||
The first random number (RN 1) is to simulate monthly demands
for tyres.
•The average selling price follows a discrete uniform distribution
and can be determined by the function =RANDBETWEEN(160,180) in this
case. But of course you will not enter (160,180) but the data cell
references where they are recorded.
•The second random number (RN 2) is used to help simulate the
profit margin.
•The average profit margin follows a continuous uniform
distribution ranging between 20% and 30% and can be determined by
the formula =0.2+(0.3-0.2)*the second random number (RN 2). Again
you do not enter 0.2 and 0.3 but the data cell references where
they are located. Note that if the random number is high, say 1,
then 0.3-0.2 becomes 1 and when added to 0.2 it becomes 0.3. If the
random number is low, say 0, then 0.3-0.2 becomes zero and the
profit margin becomes 0.2.
•Add the 12 monthly profit figures and then find the average
monthly profit.
Show the data and the model in two printouts: (1) the results, and (2) the formulas. Both printouts must show the grid (ie., row and column numbers) and be copied from Excel and pasted into Word. See Spreadsheet Advice in Interact Resources for guidance.
(b)Provide the average monthly profit to Tully Tyres over the 12-month period.
(c)You present your findings to the manager of Ajax Tyres. He thinks that with market forces he can increase the average selling price by $40 (ie from $200 to $220) without losing sales. However he does suggest that the profit margin would then increase from 22% to 32%.
He has suggested that you examine the effect of these changes and report the results to him. Change the data accordingly in your model to make the changes and paste the output in your Word answer then write a report to the manager explaining your conclusions with respect to his suggestions. Also mention any reservations you might have about the change in selling prices.
The report must be dated, addressed to the Manager and signed
off by you.
(Word limit: No more than 150 words)
In: Math
Read and comment: $2500: “A Fair Price for Hamilton” NY Times, 23 October 2016 Gregory Mankiw...
Read and comment:
$2500: “A Fair Price for Hamilton”
NY Times, 23 October 2016
- Gregory Mankiw
Consumers of goods and services do not typically wish that producers charged higher prices. But that was exactly my desire on a recent trip to New York City.
The story begins with a basic mismatch: I am a big fan of theater, and I live just outside Boston. While Boston is a good city for the arts, it is not the mecca that New York is. Unfortunately, I’m in New York only a few times every year. But when my professional or personal life takes me into the city, I always try to squeeze a play into my schedule.
That occurred most recently over Columbus Day weekend. I was in New York visiting colleges with my wife and younger son, who is a high school senior. Most colleges don’t give tours on Sunday, so we had Sunday afternoon free — perfect timing to see a matinee.
We had no doubt about what we wanted to see. “Hamilton” had received rave reviews from both critics and our friends who had seen it. We had much enjoyed “In the Heights,” an earlier musical by Lin-Manuel Miranda, the genius behind “Hamilton.” And as an economist, I have always viewed Alexander Hamilton, the first Treasury secretary, as one of the most important and intriguing founding fathers.
You may have heard that “Hamilton” tickets are hard to come by. The show is so popular that tickets from the theater sell out quickly and far in advance. On a recent episode of“Saturday Night Live (Links to an external site.)Links to an external site.” that Mr. Miranda was hosting, the television show’s producer, Lorne Michaels, jokingly asked him about getting “Hamilton” tickets. Mr. Miranda demurred.
We, however, had no problem getting tickets. Two weeks before our trip, I logged into StubHub, the online ticket marketplace owned by eBay. I found the performance we wanted, located some great seats and within a few minutes was printing our tickets.
The rub is the price. Including StubHub’s fee, I paid $2,500 a ticket, about five times their face value. Such a large markup is not unusual (Links to an external site.)Links to an external site..
Now, at this point, some people might object to this price. Terms like “scalping” and “price gouging” are pejoratives used to demonize those who resell tickets at whatever high prices the market will bear.
To be sure, most people can’t easily afford paying so much for a few hours of entertainment. That is indeed lamentable. The arts expand our horizons, and in a perfect world, everyone would have the opportunity to see a megahit like “Hamilton.”
Yet there is another way to view the situation. It was only because the price was so high that I was able to buy tickets at all on such short notice. If legal restrictions or moral sanctions had forced prices to remain close to face value, it is likely that no tickets would have been available by the time my family got around to planning its trip to the city.
High prices are a natural reflection of great demand and scant supply. In a free market, in which private individuals can engage in mutually advantageous gains from trade, they are inevitable until demand subsides or supply expands.
The comedian Jay Leno (Links to an external site.)Links to an external site. learned this lesson some years ago. In 2009, while the economy was suffering through the Great Recession, Mr. Leno, a car enthusiast, generously performed two free “Comedy Stimulus” shows for unemployed workers near Detroit.
Yet zero is not, as economists put it, the equilibrium price to see a live performance by Jay Leno. Some of the unemployed who received free tickets tried to turn around and sell them on eBay for about $800. When Mr. Leno learned about this, he objected, and eBay agreed to take down offers to resell the tickets.
But why should Mr. Leno have objected? Some unemployed workers, presumably short on cash, thought that the $800 in their pockets was more valuable than an evening of laughs. Similarly, the ticket buyers would voluntarily give up their $800 for a seat. The transaction makes both buyer and seller better off. That is how free markets are supposed to work.
The only person made worse off by the sale is, perhaps, Mr. Leno himself. He wanted to be seen performing before an audience of the unemployed. Doing a show for higher-income residents of Michigan might not be viewed as altruistic, even if it left the unemployed better off. In other words, Mr. Leno’s objection to the eBay resale was arguably a rationally self-interested act in that the resale impeded his ability to appear selfless to others and, even, to himself.
Although I don’t object to ticket resales above face value, and I think it is pernicious when others do, I was saddened by my “Hamilton” transaction in one important way. About 80 percent of what I paid went to the ticket reseller, rather than to Mr. Miranda and his investors.
In the past, Mr. Miranda has objected (Links to an external site.)Links to an external site. to the automated software that quickly buys as many tickets as it can, so they can be resold at a profit. But there is an easy way to put these resellers out of business: The theater can charge higher prices to begin with.
Such a move would surely increase the show’s profitability. From my standpoint as a theater consumer, that’s a good thing. Future talents like Mr. Miranda would find it easier to fund their innovative theater projects. And with more projects funded, those consumers who don’t buy “Hamilton” tickets — perhaps deterred by its uniquely high prices — would find a greater variety of other shows from which to choose.
- GREGORY MANKIW is a professor of economics at Harvard.
In: Economics
Pure silicon contains approximately 1.0×10^16 free electrons per cubic meter.
Pure silicon contains approximately \(1.0 \times 10^{16}\) free electrons per cubic meter.
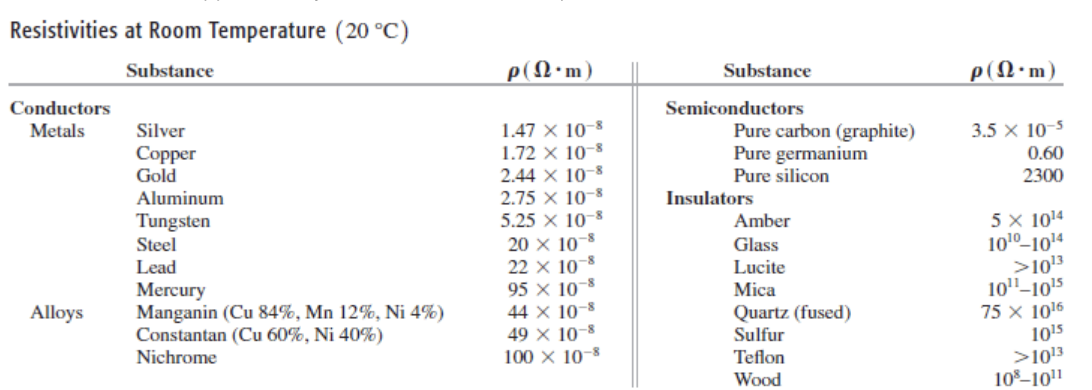
(a) Referring to the table above, calculate the mean free time? for silicon at room temperature.
(b) Your answer in part (a) is much greater than the mean free time for copper. Why, then, does pure silicon have such a high resistivity compared to copper?
In: Physics