Questions
Advanced Inheritance Concepts (Exercise 7) The Cullerton Park District holds a mini-Olympics each summer. Create a...
Advanced Inheritance Concepts (Exercise 7)
The Cullerton Park District holds a mini-Olympics each summer. Create a class named Participant with fields for a name, age, and street address. Include a constructor that assigns parameter values to each field and a toString() method that returns a String containing all the values. Also include an equals() method that determines two participants are equal if they have the same values in all three fields.
Create an application with two arrays of at least eight participants each—one holds participants in the mini-marathon, and the other holds participants in the diving competition. Prompt the user for participant values. After the data values are entered, display values for participants who are in both events.
Participant.java
public class Participant
{
// private variables here
public Participant(String n, int a, String add)
{
// constructor code here
}
public String getName()
{
// method code here
}
public int getAge()
{
// method code here
}
public String getAddress()
{
// method code here
}
public String toString()
{
// method code here
}
public boolean equals(Participant p)
{
// method code here
}
}
TwoEventParticipant.java
import java.util.*;
public class TwoEventParticipants
{
public static void main(String[] args)
{
Participant marathoners[] = new Participant[8];
Participant divers[] = new Participant[8];
int i, j;
String name;
int age;
String address;
Scanner input = new Scanner(System.in);
System.out.println("Enter mini-marathon participants");
for(i = 0; i < marathoners.length; ++i)
{
System.out.print("Enter name: ");
name = input.nextLine();
System.out.print("Enter age: ");
age = input.nextInt();
input.nextLine();
System.out.print("Enter address: ");
address = input.nextLine();
marathoners[i] = new Participant(name, age, address);
}
System.out.println("\nEnter diving participants");
for(i = 0; i < divers.length; ++i)
{
System.out.print("Enter name: ");
name = input.nextLine();
System.out.print("Enter age: ");
age = input.nextInt();
input.nextLine();
System.out.print("Enter address: ");
address = input.nextLine();
divers[i] = new Participant(name, age, address);
}
System.out.println("\nParticipants who are in both events:");
for(i = 0; i < marathoners.length; ++i)
for(j = 0; j < divers.length; ++j)
if(marathoners[i].equals(divers[j]))
System.out.println(marathoners[i].toString());
}
}
Possible Answer:
Participants who are in both events:
Participant_2
10
Apartment No. 2
Participant_6
13
Apartment No. 6
Participant_7
13
Apartment No. 7
In: Computer Science
(Using R Scholar) For each of the distributions, begin by creating 1000 random samples, each of...
(Using R Scholar) For each of the distributions, begin by creating 1000 random samples, each of size ?. Then, for each of the 1000 samples, you will calculate the sample average, ?̅. After calculating 1000 different ?̅’s, you will be able to make a histogram and normal probability plot of the ?̅ values and thus visualize the distribution of ?̅. The goal is to see what value of ? is large enough for the distribution of ?̅ to become approximately normal. Notice that this value of ? depends on the population distribution. To determine the value of ? required, your simulations will start from a small ? and progress to larger ?'s. You will assess the normality based on the plots for each ? and continue until either you have finished the values of ? listed or increased the values until observing sufficient normality in the plots.
For each of the distributions below, you will complete the following: (0.2 points) Code: You only need to provide one code listing for each distribution (i.e. you don’t need to repeat the code for each choice of ?).
2. (0.5 points) Histogram/normal probability plots For each of the values of ?, submit a histogram (with the two colored curves) and a normal probability plot. For each of the graph pairs, indicate whether they appear sufficiently normal or not. No explanation is required. Make sure you increase ? until the distribution of ?̅ appears sufficiently normal.
3. (0.3 points) Summary table This table contains the experimental mean and standard deviation calculated from the data (output is required for each value of ?) and the theoretical mean and standard deviation calculated from Equations 1 (with work for one of the values for each distribution where ? ≠ 1). The format for this table for Part B is below. Make sure you increase ? until the distribution of ?̅ appears sufficiently normal.
A. (1 points) Standard Normal Distribution. ? = 1, 3, 7 and 15.
B. (1 points) Uniform distribution over the interval (0, 8). ? = 1, 3, 7 and 15.
C. (1 points) Gamma distribution with parameters ? = ?. ?? and ? = ?. ? = 1, 5, 10, 20, 40, and continue in intervals of 20 if needed until the shape becomes normal. This distribution has population mean and standard deviation of ? = 1.805, ? = 0.95.
D. (1 points) Poisson distribution with parameter ? = ?. ?. ? = 1, 5, 10, 20, 40, and continue in intervals of 20 if needed until the shape becomes normal.
In: Statistics and Probability
- For Coronado Industries, sales is $2500000, fixed expenses are $900000, and the contribution margin ratio...
- For Coronado Industries, sales is $2500000, fixed expenses are $900000, and the contribution margin ratio is 36%. What is required sales in dollars to earn a target net income of $700000?
- Swifty Corporation reported sales of $1600000 last year (80000 units at $20 each), when the break-even point was 72000 units. Swifty’s margin of safety ratio is?
- In 2016, Coronado Industries sold 3000 units at $750 each. Variable expenses were $460 per unit, and fixed expenses were $780000. The same variable expenses per unit and fixed expenses are expected for 2017. If Coronado cuts selling price by 4%, what is Coronado’s break-even point in units for 2017?
- Vaughn Manufacturing sells two types of computer hard drives. The sales mix is 30% (Q-Drive) and 70% (Q-Drive Plus). Q-Drive has variable costs per unit of $165 and a selling price of $210. Q-Drive Plus has variable costs per unit of $180 and a selling price of $255. The weighted-average unit contribution margin for Vaughn is?
- Bramble Corp. sells two types of computer hard drives. The sales mix is 30% (Q-Drive) and 70% (Q-Drive Plus). Q-Drive has variable costs per unit of $150 and a selling price of $210. Q-Drive Plus has variable costs per unit of $165 and a selling price of $255. Bramble’s fixed costs are $729000. How many units of Q-Drive would be sold at the break-even point?
- Crane Company can produce and sell only one of the following two products:
| Oven | Contribution | |
| Hours Required | Margin per Unit | |
| Muffins | 0.2 | $2 |
| Coffee Cakes | 0.3 | $8 |
The company has oven capacity of 2250 hours. How much will
contribution margin be if it produces only the most profitable
product?
- Crane Company has sales of $1000000, variable costs of $400000, and fixed costs of $500000. Crane’s degree of operating leverage is?
- Sheridan Company has sales of $2500000, variable costs of $1000000, and fixed costs of $810000. Sheridan’s margin of safety ratio is?
In: Accounting
You are opening a landscaping business, and wish to estimate your levered cost of equity. Beatrice's...
You are opening a landscaping business, and wish to estimate your levered cost of equity. Beatrice's Yard Maintenance has an equity beta of 1.3, and a D/E ration of 0.8. If the riskless rate is 0.04, the expected return on the S&P500 is 0.14, and your firm will have a D/E ratio of 1, what would your firm's levered cost of equity be if the tax rate is 0.31? Please give your answer in the form of a decimal to 2 places - if your answer is 10.5%, please enter 0.105.
In: Finance
Two stocks each pay a $1 dividend that is growing annually at 4 percent. Stock A's beta = 1.3; stock B's beta = 0.8.
Two stocks each pay a $1 dividend that is growing annually at 4 percent. Stock A's beta = 1.3; stock B's beta = 0.8.
a. Which stock is more volatile?
b. If Treasury bills yield 2 percent and you expect the market to rise by 8 percent, what is your risk-adjusted required return for each stock?
c. Using the dividend-growth model, what is the maximum price you would be willing to pay for each stock?
d. Why are their valuations different?
In: Finance
An employee receives an hourly wage rate of $16, with time-and-a-half for all hours worked in excess of 40 during the week.
An employee receives an hourly wage rate of $16, with time-and-a-half for all hours worked in excess of 40 during the week. Payroll data for the current week are as follows: hours worked, 47; federal income tax withheld, $145; social security tax rate, 6.0%; Medicare tax rate, 1.5%; state unemployment compensation tax, 3.4% on the first $7,000; and federal unemployment compensation tax, 0.8% on the first $7,000. What is the net amount to be paid to the employee? Round your answer to the nearest cent.
In: Accounting
6. Changes in taxes The following graph shows the aggregate demand curve. Shift the aggregate demand...
6. Changes in taxes
The following graph shows the aggregate demand curve.
Shift the aggregate demand curve on the graph to show the impact of a tax cut.
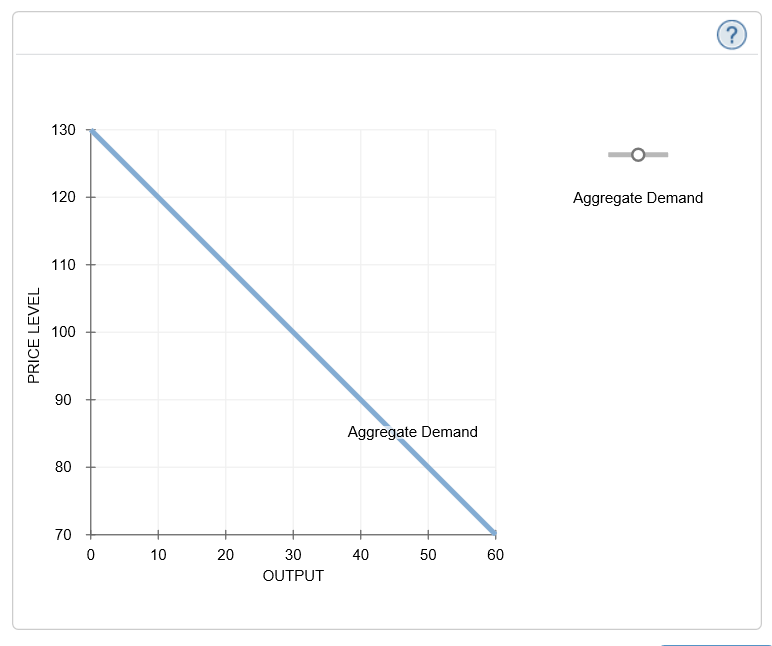
Suppose the governments of two different economies, economy X and economy Y, implement a permanent tax cut of the same size. The marginal propensity to consume (MPC) in economy X is 0.75 and the MPC in economy Y is 0.8. The economies are identical in all other respects.
The tax cut will have a larger impact on aggregate demand in the economy with the (larger MPC/ smaller MPC)
In: Economics
Future value of an ordinary annuity. Fill in the missing futurevalues in the following table...
Future value of an ordinary annuity. Fill in the missing future values in the following table for an ordinary annuity:
Number of Payments or Years | Annual Interest Rate | Present Value | Annuity | Future Value | ||||
6 | 7% | 0 |
| $270.26 | ||||
(Click on the following icon in order to copy its contents into a spreadsheet.)
Number of Payments or Years | Annual Interest Rate | Present Value | Annuity | Future Value | ||||
6 | 7% | 0 |
| $270.26 | ? | |||
17 | 15% | 0 | $1,261.39 | ? | ||||
27 | 3.5% | 0 | $732.59 | ? | ||||
320 | 0.8% | 0 | $503.85 | ? | ||||
In: Finance
Assume that today is October 15th. It is known that a certainTreasury bond is the...
Assume that today is October 15th. It is known that a certain Treasury bond is the cheapest to deliver bond on the Treasury futures contract. The cheapest to deliver bond has a 5% coupon and the last coupon payment was on June 3rd. Today’s quoted price for the bond is $92. The first day that delivery can take place is December 20th. Assume that the term structure of interest rates is constant and the rate of interest (based on continuous compounding) is equal to 6%. If the conversion factor for the cheapest to deliver bond is 0.8, what is the Treasury futures price?
In: Finance
The expected return on Big Time Toys is 11 percent and its standard deviation is 19...
The expected return on Big Time Toys is 11 percent and its standard deviation is 19 percent. The expected return on Chemical Industries is -1 percent and its standard deviation is 23 percent. Suppose the correlation coefficient for the two stocks' returns is 0.8. What are the expected and standard deviation of a portfolio with 70 percent invested in Big Time Toys and the rest in Chemical Industries?
Enter your answers as percentages rounded to 2 decimal places. Do not include the percentage sign in your answers.
E(rp) =
Std. Dev.=
In: Finance