Questions
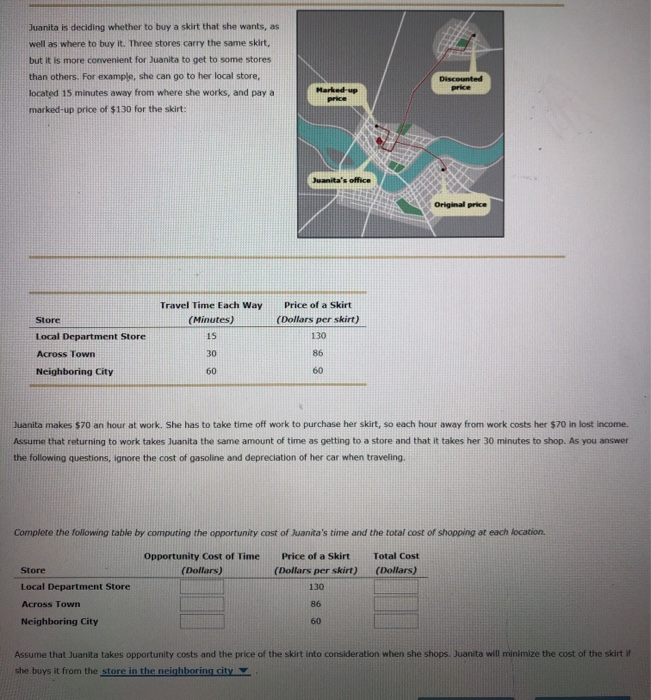
Juanita is deciding whether to buy a skirt that she wants, as well as where to...
Juanita is deciding whether to buy a skirt that she wants, as well as where to buy it. Three stores carry the same skirt, but it is more convenient for Juanita to get to some stores than others. For example, she can go to her local store, located 15 minutes away from where she works, and pay a marked-up price of $130 for the skirt:
| Travel Time Each Way | Price of a Skirt | |
|---|---|---|
| Store | (Minutes) | (Dollars per skirt) |
| Local Department Store | 15 | 130 |
| Across Town | 30 | 86 |
| Neighboring City | 60 | 60 |
Juanita makes $70 an hour at work. She has to take time off work to purchase her skirt, so each hour away from work costs her $70 in lost income. Assume that returning to work takes Juanita the same amount of time as getting to a store and that it takes her 30 minutes to shop. As you answer the following questions, ignore the cost of gasoline and depreciation of her car when traveling.
Complete the following table by computing the opportunity cost of Juanita's time and the total cost of shopping at each location.
| Store | Opportunity Cost of Time (Dollars) | Price of a Skirt (Dollars per skirt) | Total Cost (Dollars) |
|---|---|---|---|
| Local Department Store | 130 | ||
| Across Town | 86 | ||
| Neighboring City | 60 |
Assume that Juanita takes opportunity costs and the price of the skirt into consideration when she shops. Juanita will minimize the cost of the skirt if she buys it from the store in the neighboring city.
In: Accounting
A club has 50 members of which 20 are freshmen, 15 are sophomores, 10 are juniors...
A club has 50 members of which 20 are freshmen, 15 are sophomores, 10 are juniors and 5 are seniors.
a) How many ways are there to select a president, a senior vice president, and a vice president if they can not be from the same class?
b) How many ways are there to select one president, and two vice presidents if they can not be from the same class?
In: Statistics and Probability
Create a program/function using PYTHON that takes cents and returns to the customer how MANY coins...
Create a program/function using PYTHON that takes cents and returns to the customer how MANY coins it takes to make the change...
Ex. if the change owed is 50 cents then return a 2 (for two quarters)
if the change owed is 10 cents then return a 1 (for one dime)
AGAIN please write this in java and please provide EXPLANATION of answer
In: Computer Science
Two methods of maintenance for indefinite service life are being evaluated: Method 1. The first cost...
Two methods of maintenance for indefinite service life are being evaluated:
Method 1. The first cost would be $60,000, and $25,000 would be required at five-year intervals forever.
Method 2. The first cost would be $150,000, and $180,000 would be required at 50-year intervals of forever.
At I i = 12%, which method is the better one?
In: Economics
One year ago, your company purchased a machine used in manufacturing for $ 90 comma 000....
One year ago, your company purchased a machine used in manufacturing for $ 90 comma 000. You have learned that a new machine is available that offers many advantages and that you can purchase it for $ 170 comma 000 today. The CCA rate applicable to both machines is 40 %; neither machine will have any long-term salvage value. You expect that the new machine will produce earnings before interest, taxes, depreciation, and amortization (EBITDA) of $ 45 comma 000 per year for the next 10 years. The current machine is expected to produce EBITDA of $ 22 comma 000 per year. All other expenses of the two machines are identical. The market value today of the current machine is $ 50 comma 000. Your company's tax rate is 42 %, and the opportunity cost of capital for this type of equipment is 11 %. Should your company replace its year-old machine?
In: Accounting
The following table shows student’s test scores on the first two tests in an introductory biology...
The following table shows student’s test scores on the first two tests in an introductory biology class.
|
First test, x |
Second test, y |
|
55 |
58 |
|
40 |
43 |
|
71 |
68 |
|
82 |
86 |
|
90 |
87 |
|
50 |
51 |
|
83 |
87 |
|
75 |
70 |
|
65 |
67 |
|
52 |
55 |
|
77 |
77 |
|
93 |
90 |
(a) Draw a scatter plot using one the following website(s):
http://www.alcula.com/calculators/statistics/scatter-plot/ or
https://www.meta-chart.com/scatter
(b) Estimate the correlation in words (positive, negative, or no
correlation)
(c) Calculate the correlation coefficient, r.
(d) Determine whether r is statistically significant at the 0.01
level of significance.
(e) Determine whether r is statistically significant at the 0.05
level of significance.
(f) Calculate the coefficient of determination,
r2.
(g) Interpret the meaning of r2 for the given set
of data.
(h) Find the equation of the least-squares regression line, if
appropriate.
In: Statistics and Probability
NOTE that significant marks will be lost if your answer does not include the NUMERICAL FORMULA....
NOTE that significant marks will be lost if your answer does not include the NUMERICAL FORMULA.
Question 1 (25 marks/ Time Value of Money and WACC)
(a) You need to pay off a car loan within the next two years. The payment will be $4,000 every month. Today you have made a single deposit into a return-guaranteed investment account that will allow you to cope with all the monthly payments. This account earns an effective annual interest rate of 12.68250301%. The first payment will be made in one month.
-
(i) Calculate the corresponding monthly rate for the investment account.
-
(ii) “You need to have at least $96,000 at your account today in order to make all the payments on the car loan in the next two years.” True or false? Briefly explain without doing any time value of money related (i.e. PVA or FVA) calculations.
-
(iii) What is the amount of the single deposit made today?
-
(iv) If your mother is going to make the first year’s repayments for you (as a birthday gift) and thus you don’t need to withdraw the $4,000 every month from the investment account, how much more money will you have in your bank account two years from
now?
In: Finance
Problem 17-12 Determine pension expense; journal entries; two years [LO17-3, 17-4, 17-5, 17-6, 17-7, 17-8] The...
Problem 17-12 Determine pension expense; journal entries; two years [LO17-3, 17-4, 17-5, 17-6, 17-7, 17-8]
The Kollar Company has a defined benefit pension plan. Pension
information concerning the fiscal years 2018 and 2019 are presented
below ($ in millions):
Information Provided by Pension Plan Actuary:
- Projected benefit obligation as of December 31, 2017 = $3,950.
- Prior service cost from plan amendment on January 2, 2018 = $850 (straight-line amortization for 10-year average remaining service period).
- Service cost for 2018 = $690.
- Service cost for 2019 = $740.
- Discount rate used by actuary on projected benefit obligation for 2018 and 2019 = 10%.
- Payments to retirees in 2018 = $550.
- Payments to retirees in 2019 = $620.
- No changes in actuarial assumptions or estimates.
- Net gain—AOCI on January 1, 2018 = $465.
- Net gains and losses are amortized for 10 years in 2018 and 2019.
Information Provided by Pension Fund Trustee:
- Plan asset balance at fair value on January 1, 2018 = $2,800.
- 2018 contributions = $710.
- 2019 contributions = $760.
- Expected long-term rate of return on plan assets = 12%.
- 2018 actual return on plan assets = $260.
- 2019 actual return on plan assets = $310.
Required:
1. Calculate pension expense for 2018 and 2019.
2. Prepare the journal entries for 2018 and 2019 to record pension
expense.
3. Prepare the journal entries for 2018 and 2019 to record any
gains and losses and new prior service cost.
4. Prepare the journal entries for 2018 and 2019 to record the cash
contribution to plan assets and benefit payments to retirees.
In: Accounting
Problem 17-12 Determine pension expense; journal entries; two years [LO17-3, 17-4, 17-5, 17-6, 17-7, 17-8] The...
Problem 17-12 Determine pension expense; journal entries; two years [LO17-3, 17-4, 17-5, 17-6, 17-7, 17-8]
The Kollar Company has a defined benefit pension plan. Pension
information concerning the fiscal years 2018 and 2019 are presented
below ($ in millions):
Information Provided by Pension Plan Actuary:
Projected benefit obligation as of December 31, 2017 = $1,850.
Prior service cost from plan amendment on January 2, 2018 = $550 (straight-line amortization for 10-year average remaining service period).
Service cost for 2018 = $550.
Service cost for 2019 = $600.
Discount rate used by actuary on projected benefit obligation for 2018 and 2019 = 10%.
Payments to retirees in 2018 = $410.
Payments to retirees in 2019 = $480.
No changes in actuarial assumptions or estimates.
Net gain—AOCI on January 1, 2018 = $245.
Net gains and losses are amortized for 10 years in 2018 and 2019.
Information Provided by Pension Fund Trustee:
Plan asset balance at fair value on January 1, 2018 = $1,400.
2018 contributions = $570.
2019 contributions = $620.
Expected long-term rate of return on plan assets = 12%.
2018 actual return on plan assets = $120.
2019 actual return on plan assets = $170.
Required:
1. Calculate pension expense for 2018 and 2019.
2. Prepare the journal entries for 2018 and 2019 to record pension
expense.
3. Prepare the journal entries for 2018 and 2019 to record any
gains and losses and new prior service cost.
4. Prepare the journal entries for 2018 and 2019 to record the cash
contribution to plan assets and benefit payments to
retirees.
In: Accounting
1. Find the appropriate measure of center. Discuss why the chosen measure is most appropriate. Why...
1. Find the appropriate measure of center. Discuss why the chosen measure is most appropriate. Why did you decide against other possible measures of center? 2. Find the appropriate measure of variation. The measure of variation chosen here should match the measure of center chosen in Part 1. 3. Find the graph(s) needed to appropriately describe the data. These may be done by hand and inserted into the Word document. You can also use Excel or a Web Applet to create a Histogram of the chosen data. Graphs can be copied and pasting onto the template. 4. Define the random variable (X) so that your chosen data set represents values of X. 5. Is your chosen random variable discrete or continuous? Explain how you know. 6. Would the Normal or Binomial distribution be a good fit for the underlying sample distribution of X? If one of them is a good fit, state how you would approximate the distribution parameters (Use the mean and standard deviation of the data chosen) 7. If you selected column D, calculate the probability that a flight will depart early or on-time. If you selected column E, calculate the probability that a flight will arrive early or on time using the empirical definition of probability. 8. If you selected column D, calculate the probability that a flight will depart late. If you selected column E, calculate the probability that a flight will arrive late using the empirical definition of probability. 9. For those that selected column D, assume now that the random variable X = Departure Time is exactly normally distributed with mean m= -2.5 and standard deviation s= 23. Compute the probability of a flight arriving late based on this new information. For those that selected column E, assume now that the random variable X = Arrival Time is exactly normally distributed with mean m= -2.5 and standard deviation s= 23. Does this contradict your answer from Part 8? Data: 0 -3 0 -7 8 -1 3 11 -6 -5 -8 -4 -13 -13 -11 -14 -16 -14 -18 -18 -23 -23 2 1 -4 -6 7 -8 -8 -4 -4 -5 -13 -9 -12 -7 -12 1 4 -19 -13 -19 3 12 13 2 0 0 4 -7 8 9 -1 -10 -6 -12 -14 -13 9 -15 -13 -14 20 -16 11 -14 18 -19 -3 -4 0 -3 2 6 6 -6 1 11 -7 -10 -13 9 -13 -18 -17 -11 -20 -18 8 0 -20 -3 1 -1 -4 -6 -5 -8 -10 -9 -6 8 -9 -12 -15 -14 -9 -17 -13 -17 2 -18 -18 -16 1 -4 0 -5 7 -7 -7 -5 0 5 -6 -12 1 6 -10 -15 -18 -16 -17 0 -21 -18 5 1 3 -2 -1 -2 -3 4 3 -11 9 -11 -11 0 -11 17 -10 -11 0 -19 -18 0 8 -23 3 -3 -4 -6 0 2 -1 -9 -9 4 1 -9 -12 0 0 -11 -14 -19 -17 -13 23 8 21 3 4 -2 1 6 7 -9 -3 1 -9 -5 -11 -6 -6 -10 -13 -9 -17 -6 -20 1 -21 -22 -2 0 -4 -3 3 -5 -6 -3 -5 -8 -12 -10 -7 -16 1 -14 -14 -16 -7 13 -17 -16 7 0 1 1 4 1 -8 -5 -9 0 -4 8 -7 -14 7 -8 5 4 8 21 3 11 2 -23 0 4 3 2 0 -1 -7 5 3 8 12 -12 -15 -11 -7 17 -15 -13 -17 -21 4 -19 -24 3 0 4 0 -2 -8 -5 6 5 1 -12 -14 7 8 -16 -11 -17 -20 10 4 -14 -22 -22 -3 -4 2 -4 -2 0 6 -6 2 -9 -3 -10 -13 7 -10 -12 -13 -16 -20 1 -14 -21 -17 3 -1 -1 0 -2 -7 -4 0 11 3 -11 -12 -11 -8 -13 -16 -16 7 2 -21 3 9 0 3 0 -5 -3 -3 -3 -3 -4 9 0 -8 -10 12 5 -16 -16 -13 -13 3 -19 0 -20 2 -3 -2 3 5 -1 -8 -3 -7 -11 -7 -10 12 -12 -8 17 -9 -18 -17 -14 1 -13 -21 -22 -2 -3 3 -3 -2 -7 -5 -10 -8 -6 -13 11 -11 -16 -9 -13 -12 -13 -16 -10 -20 -19 -22 -1 -4 2 4 -3 -8 4 -3 -7 -11 -13 2 -13 -12 -15 3 -17 -10 3 0 -19 -20 -20 0 0 -5 -4 -3 -5 -1 -8 -7 -2 13 11 -10 -12 -15 -14 -17 -18 6 12 6 -19 -20 0 -1 -5 -1 4 6 3 8 0 -11 -8 -14 -13 -11 3 -7 -11 10 -19 -20 -21 0 3 0 -4 0 2 -6 -7 -6 -7 8 -12 -2 -13 -7 9 -15 -14 -14 -17
In: Advanced Math