Questions
Everest Climbers reported the following information for 2016 and 2017: 2016 2017 Accounts receivable $50...
In: Accounting
The Murdock Corporation reported the following balance sheet data for 2016 and 2015: 2016 2015 Cash...
The Murdock Corporation reported the following balance sheet data for 2016 and 2015: 2016 2015 Cash $ 80,705 $ 24,755 Available-for-sale securities (not cash equivalents) 17,000 88,000 Accounts receivable 83,000 70,950 Inventory 168,000 147,700 Prepaid insurance 1,770 2,300 Land, buildings, and equipment 1,256,000 1,128,000 Accumulated depreciation (613,000 ) (575,000 ) Total assets $ 993,475 $ 886,705 Accounts payable $ 79,040 $ 151,670 Salaries payable 21,200 26,000 Notes payable (current) 27,700 78,000 Bonds payable 203,000 0 Common stock 300,000 300,000 Retained earnings 362,535 331,035 Total liabilities and shareholders' equity $ 993,475 $ 886,705 Additional information for 2016: Sold available-for-sale securities costing $71,000 for $75,800. Equipment costing $20,000 with a book value of $5,300 was sold for $6,450. Issued 6% bonds payable at face value, $203,000. Purchased new equipment for $148,000 cash. Paid cash dividends of $21,500. Net income was $53,000. Required: Prepare a statement of cash flows for 2016 in good form using the indirect method for cash flows from operating activities. (Amounts to be deducted should be indicated with a minus sign.)
In: Accounting
36. Below is information for Dakota Corp. for 2016 and 2017: Bonds payable, December 31, 2016 ...
36. Below is information for Dakota Corp. for 2016 and
2017:
Bonds payable, December 31, 2016 $500,000
Bonds payable, December 31, 2017 800,000
Loss on bond retirement—2017 15,000
Interest expense on bonds—2017 45,000
At the end of 2017, Dakota issued bonds at par value for $800,000 cash. The proceeds from these bonds were used to retire the $500,000 bond issue outstanding at the end of 2017 (before their maturity date). All interest expense was paid in cash during 2017.
The following statements describe how Dakota reported
the cash flow effects of the items described above on its 2017
statement of cash flows. The indirect method is used to prepare the
operating activities section. Which of the following has been
reported incorrectly by Dakota?
a. Proceeds of $800,000 from the
issuance of bonds were reported as a cash inflow in the financing
activities section.
b. The loss on bond retirement of
$15,000 was added to net income in the operating activities
section.
c. Payments of $560,000 were
reported as a cash outflow in the investing activities
section.
d. Interest expense of $45,000 was
not reported separately because it is included in net income in the
operating activities section.
38. Below are the transactions for the Louisville Company:
Proceeds from issuance of bonds payable $635,000
Payment to purchase equipment $275,000
Payment of wages $115,000
Payment of dividends $155,000
Payment to pay off notes payable $195,000
Based on these transactions, what is the net cash flow
from financing activities?
a. $285,000 net cash provided by
financing activities.
b. $275,000 net cash used for
financing activities.
c. $0, because cash inflows equal
cash outflows from financing activities.
d. $440,000 net cash provided by
financing activities.
40. During 2016, the accounts payable balance of Andreas
Corp. decreased. Which of the following statements is
true?
a. This decrease indicates that
Andreas paid less during the period than it recognized as expenses
on the income statement.
b. This decrease is added to net
income in the operating activities section of a statement of cash
flows prepared under the indirect method.
c. This decrease is deducted from
net income in the operating activities section of a statement of
cash flows prepared under the indirect method.
d. This decrease is considered only
when the operating activities section of a statement of cash flows
is prepared under the direct method.
42. Caler Corp. reported the following information for 2016 and
2017.
Accounts receivable, December 31, 2016 $ 67,000
Accounts receivable, December 31, 2017 63,000
Sales (all on credit)—2017 745,000
How much cash was collected from customers during
2017?
a. $741,000
b. $745,000
c. $749,000
d. $753,000
In: Accounting
The following financial statements relate to Techmation Ltd for 2016 and 2017 respectively. Assets 2016 2017...
The following financial statements relate to Techmation Ltd for 2016 and 2017 respectively.
| Assets | 2016 | 2017 |
| Non current Assets | 1 315 000 | 1 180 000 |
| Inventory | 150 000 | 170 000 |
| Trade Debtors | 525 000 | 450 000 |
| 1 990 000 | 1 800 000 | |
| Equity & Liabilities | ||
| Ordinary share capital | 1 000 000 | 1 000 000 |
| Distributable Reserve | 700 000 | 500 000 |
| Bank Overdraft | 80 000 | 110 000 |
| Trade Creditors | 210 000 | 190 000 |
| 1 900 000 | 1 800 000 |
| 2016 | 2017 | |
| Sales | 1 800 000 | 1 500 000 |
| Cost of Sales | 1 200 000 | 800 000 |
| Gross Profit | 600 000 | 700 000 |
| Less: Expenditure | 150 000 | 120 000 |
| Profit before interest and Tax | 450 000 | 580 000 |
| Interest | 50 000 | 40 000 |
| Profit before Tax | 400 000 | 540 000 |
| Taxation | 120 000 | 160 000 |
| Net Profit for the year | 280 000 | 380 000 |
Required: 2.1 Calculate each of the following accounting ratios for both years:
2.1.1 Gross Margin Percentage (3)
2.1.2 Mark-up Percentage (3)
2.1.3 Return on Assets before Interest and Tax (do not use average figures) (3)
2.1.4 Current Ratio (3) 2.1.5 Acid-test Ratio (3)
2.1.6 Return on Equity (do not use average figures) (3)
2.2 Comment on the trends for the following ratios:
2.2.1 Gross margin percentage (3)
2.2.2 Current Ratio (2)
2.2.3 Acid-test ratio (2)
In: Finance
Alakazam Corp. began business on January 1, 2016. At December 31, 2016, it had a $4,500...
Alakazam Corp. began business on January 1, 2016. At December 31, 2016, it had a $4,500 balance in the Deferred Tax Liability account that pertains to property, plant, and equipment acquired during 2016 at a cost of $900,000. The property, plant, and equipment is being depreciated on a straight-line basis over six years for financial reporting purposes, and is a Class 8—20% asset for tax purposes. Alakazam’s income before income tax for 2017 was $60,000. Alakazam Corp. follows IFRS and the half-year convention for depreciation.
The following items caused the only differences between accounting income before income tax and taxable income in 2017.
In 2017, the company paid $56,250 for rent; of this amount, $18,750 was expensed in 2017. The other $37,500 will be expensed equally over the 2018 and 2019 accounting periods. The full $56,250 was deducted for tax purposes in 2017.
Alakazam pays $9,000 a year for a membership in a local golf club for the company’s president.
Alakazam now offers a one-year warranty on all its merchandise sold. Warranty expenses for 2017 were $9,000. Cash payments in 2017 for warranty repairs were $4,500.
Meals and entertainment expenses (only 50% of which are ever tax deductible) were $12,000 for 2017.
The maximum allowable CCA was taken in 2017. There were no asset disposals for 2017. Income tax rates have not changed since the company began operations.
Required:
1. Calculate the balance in the Deferred Tax Asset or Deferred Tax Liability account at December 31, 2017.
2. Calculate income tax payable for 2017.
3. Prepare the journal entries to record income taxes for 2017.
4. Prepare the income tax expense section of the income statement for 2017, beginning with the line “Income before income tax.”
5. Indicate how deferred taxes should be presented on the December 31, 2017 statement of financial position.
6. How would your response to parts (a) to (e) change if Alakazam reported under ASPE?
In: Accounting
Home Depot entered fiscal 2016 with a total capitalization of $27,255 million. In 2016, debt investors...
Home Depot entered fiscal 2016 with a total capitalization of $27,255 million. In 2016, debt investors received interest income of $844 million. Net income to shareholders was $6,387 million. (Assume a tax rate of 35%.) Calculate the economic value added assuming its cost of capital is 10%
In: Finance
The POL Company had started its operations in 2016. The balance sheet for December 31, 2016,...
The POL Company had started its operations in 2016. The balance sheet for December 31, 2016, showed the following accounts balances (there were no other accounts listed):
Accounts receivables 45
Unearned revenue 40
Accumulated depreciation 10
Common stock 500
Retained earnings 57
Property plant and equipment (gross) 200
Inventory 75
Accounts payable 40
Cash 309
Prepaid rent ______
During 2017 the following transactions occurred:
1. POL purchased $375 worth of inventory on account.
2.Payments on Accounts payable were $365.
3.Cash sales were $260; credit sales were $360.
4.Ending inventory was $59.
5.Depreciation expense was $20.
6.Collections from customers (not including cash sales) were $312.
7. The Prepaid rent had expired during the year.
8. POL hired one employee, who worked for the entire year at $4 per month. At the end of the year, POL owes its employee $6.
9.Dividend of $24 was declared and paid during 2017.
10. On the last day of the year, POL gave a loan of $50 to its twin sister company, CLA.
11.Unearned revenue account remained intact during 2017.
a.What was the balance of the Prepaid rent account on December 31, 2016?
b.Record journal entries for all transactions occurred during 2017.
c.Prepare an Income Statement for the year ended December 31, 2017.
d. Prepare a Balance Sheet for December 31, 2017.
In: Accounting
Refer to the Baseball 2016 data, which reports information on the 2016 Major League Baseball season....
Refer to the Baseball 2016 data, which reports information on the 2016 Major League Baseball season. Let attendance be the dependent variable and total team salary be the independent variable. Determine the regression equation and answer the following questions.
Draw a scatter diagram. From the diagram, does there seem to be a direct relationship between the two variables?
What is the expected attendance for a team with a salary of $100.0 million?
If the owners pay an additional $30 million, how many more people could they expect to attend?
At the .05 significance level, can we conclude that the slope of the regression line is positive? Conduct the appropriate test of hypothesis.
What percentage of the variation in attendance is accounted for by salary?
Determine the correlation between attendance and team batting average and between attendance and team ERA. Which is stronger? Conduct an appropriate test of hypothesis for each set of variables.
Show all work in Excel
| Team | League | Year Opened | Team Salary | Attendance | Wins | ERA | BA | HR | Year | Average salary | ||
| Arizona | National | 1998 | 65.80 | 2080145 | 79 | 4.04 | 0.264 | 154 | 2000 | 1988034 | ||
| Atlanta | National | 1996 | 89.60 | 2001392 | 67 | 4.41 | 0.251 | 100 | 2001 | 2264403 | ||
| Baltimore | American | 1992 | 118.90 | 2281202 | 81 | 4.05 | 0.250 | 217 | 2002 | 2383235 | ||
| Boston | American | 1912 | 168.70 | 2880694 | 78 | 4.31 | 0.265 | 161 | 2003 | 2555476 | ||
| Chicago Cubs | National | 1914 | 117.20 | 2959812 | 97 | 3.36 | 0.244 | 171 | 2004 | 2486609 | ||
| Chicago Sox | American | 1991 | 110.70 | 1755810 | 76 | 3.98 | 0.250 | 136 | 2005 | 2632655 | ||
| Cincinnati | National | 2003 | 117.70 | 2419506 | 64 | 4.33 | 0.248 | 167 | 2006 | 2866544 | ||
| Cleveland | American | 1994 | 87.70 | 1388905 | 81 | 3.67 | 0.256 | 141 | 2007 | 2944556 | ||
| Colorado | National | 1995 | 98.30 | 2506789 | 68 | 5.04 | 0.265 | 186 | 2008 | 3154845 | ||
| Detroit | American | 2000 | 172.80 | 2726048 | 74 | 4.64 | 0.270 | 151 | 2009 | 3240206 | ||
| Houston | American | 2000 | 69.10 | 2153585 | 86 | 3.57 | 0.250 | 230 | 2010 | 3297828 | ||
| Kansas City | American | 1973 | 112.90 | 2708549 | 95 | 3.73 | 0.269 | 139 | 2011 | 3305393 | ||
| LA Angels | American | 1966 | 146.40 | 3012765 | 85 | 3.94 | 0.246 | 176 | 2012 | 3440000 | ||
| LA Dodgers | National | 1962 | 230.40 | 3764815 | 92 | 3.44 | 0.250 | 187 | 2013 | 3650000 | ||
| Miami | National | 2012 | 84.60 | 1752235 | 71 | 4.02 | 0.260 | 120 | 2014 | 3950000 | ||
| Milwaukee | National | 2001 | 98.70 | 2542558 | 68 | 4.28 | 0.251 | 145 | 2015 | 4250000 | ||
| Minnesota | American | 2010 | 108.30 | 2220054 | 83 | 4.07 | 0.247 | 156 | ||||
| NY Mets | National | 2009 | 100.10 | 2569753 | 90 | 3.43 | 0.244 | 177 | ||||
| NY Yankees | American | 2009 | 213.50 | 3193795 | 87 | 4.05 | 0.251 | 212 | ||||
| Oakland | American | 1966 | 80.80 | 1768175 | 68 | 4.14 | 0.251 | 146 | ||||
| Philadelphia | National | 2004 | 133.00 | 1831080 | 63 | 4.69 | 0.249 | 130 | ||||
| Pittsburgh | National | 2001 | 85.90 | 2498596 | 98 | 3.21 | 0.260 | 140 | ||||
| San Diego | National | 2004 | 126.60 | 2459742 | 74 | 4.09 | 0.243 | 148 | ||||
| San Francisco | National | 2000 | 166.50 | 3375882 | 84 | 3.72 | 0.267 | 136 | ||||
| Seattle | American | 1999 | 123.20 | 2193581 | 76 | 4.16 | 0.249 | 198 | ||||
| St. Louis | National | 2006 | 120.30 | 3520889 | 100 | 2.94 | 0.253 | 137 | ||||
| Tampa Bay | American | 1990 | 74.80 | 1287054 | 80 | 3.74 | 0.252 | 167 | ||||
| Texas | American | 1994 | 144.80 | 2491875 | 88 | 4.24 | 0.257 | 172 | ||||
| Toronto | American | 1989 | 116.40 | 2794891 | 93 | 3.8 | 0.269 | 232 | ||||
| Washington | National | 2008 | 174.50 | 2619843 | 83 | 3.62 | 0.251 | 177 |
In: Math
4. Calculating taxable income For 2016, the personal exemption amount is $4,050. The 2016 standard deduction...
4. Calculating taxable income
For 2016, the personal exemption amount is $4,050. The 2016 standard deduction is $6,300 for unmarried taxpayers or married taxpayers filing separately, $12,600 for married taxpayers filing jointly, and $9,300 for taxpayers filing as head of household.
Calculating Heidi’s Taxable Income
Heidi is an unmarried person filing single. Calculate Heidi’s 2016 taxable income by filling in the worksheet. Enter adjustments, deductions, and exemptions as negative numbers. If your answer is zero, enter "0".
• Heidi will earn $90,965 in wages this year.
• She contributed $4,000 to an IRA.
• She received a gift from her parents to put a down payment on a new car totaling $5,000.
• She uses the standard deduction.
• She donated $1,000 to charity.
• She is entitled to one exemption.
|
2016 Taxable Income |
|
|---|---|
| Gross income | |
| Less: Adjustments to income | |
| Adjusted gross income | |
| Less: Deductions | |
| Subtotal | |
| Less: Exemptions | |
| Taxable income |
In: Finance
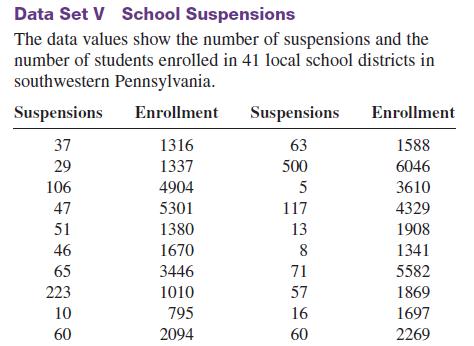
Randomly select 10 values from the number of suspensions in the local school districts in southwestern Pennsylvania in Data Set V in Appendix B.
Randomly select 10 values from the number of suspensions in the local school districts in southwestern Pennsylvania in Data Set V in Appendix B. Find the mean, median, mode, range, variance, and standard deviation of the number of suspensions by using the Pearson coefficient of skewness.
Data from Set V Appendix B
In: Statistics and Probability